Brand Positioning Map: How to Build One Before You Design the Pack
A brand positioning map is a two-axis chart that shows where brands in a category sit in the shopper’s mind, so you can see which spaces are crowded, which are empty, and where your own brand should stand. The axes are the two things buyers in that category actually weigh against each other, such as price against naturalness, or heritage against modern. Each competitor is a dot. Your brand is a dot too, where it is now and where you want it to be, and the distance between those two dots is the job for strategy, packaging, and everything that follows.
For a consumer packaged good the map is the most useful single page you can bring to a designer. It replaces “make it look premium” with “move from here to there, away from these two brands and toward this empty corner.” This guide covers what the map is, how to pick axes that mean something, where to get honest data for the dots, how to read the result, and how the map becomes a packaging brief.
Positioning map, perceptual map, positioning matrix
The terms overlap and people use them loosely.
- A perceptual map is built from customer perception data: you ask buyers to rate brands on attributes and plot the answers. It shows the market as shoppers see it today.
- A positioning map uses the same chart to make a decision: where the brand should sit relative to competitors. It can start from perception data, from objective product facts such as price and ingredients, or from a structured judgment by the team.
- A positioning matrix is the same chart, often drawn as four labeled quadrants, and a brand positioning chart is a general name for any of them.
In practice you draw one map and use it for both jobs: first to describe the shelf as it is, then to choose a place on it. What matters is that the dots reflect how shoppers see the brands, and not how the brands describe themselves.
Why build one before you design packaging
Packaging design turns a position into something a shopper can see from six feet away. If the position is vague, the design brief is vague, and the result is a pack that looks fine and says nothing in particular. Three things a map does for a packaging project:
- It names the competitors that matter. Not every brand in the category, just the ones in your neighborhood on the map, whose packs yours will sit next to and be compared with.
- It turns adjectives into directions. “Premium” is an adjective. “Further from the value brands on price, closer to the artisan brands on craft, without the artisan brands’ tiny type” is a direction a designer can act on.
- It exposes the empty space, and whether it is empty for a reason. A corner with no brands in it is either an opportunity or a place nobody wants to be. The map makes you ask which.
Our rebranding checklist puts mapping the competitive shelf in the positioning stage, before any visuals, for exactly this reason: the decision about where to go has to come before any decision about how it should look.
How to build a brand positioning map in five steps
Step 1. Decide what the map is for
A map for a new launch asks “where is there room?” A map for a redesign asks “where are we now, and where should we be?” A map for a line extension asks “does the new product sit near the parent or somewhere else?” Write the question at the top of the page. It will decide the axes.
Step 2. Choose two axes that shoppers actually use
This is the step that decides whether the map is useful. The axes should be:
- Things buyers trade off when they choose in this category. In snacks, “better for you” against “indulgent.” In coffee, “everyday” against “specialty.” In cleaning products, “powerful” against “gentle or natural.” In pet food, “science” against “natural.”
- Independent of each other. Price and quality move together in most categories, so a price-quality map puts everyone on a diagonal and tells you little. Price, or better the price tier as shoppers perceive it, against a non-price attribute is more revealing.
- Describable at both ends. If you cannot say what the far left and far right look like on a pack, the axis is too abstract.
Good first candidates for food and drink: price or tier (value to premium), naturalness (processed to clean), convenience (scratch to ready), tradition (heritage to modern), intensity (mild to bold), audience (kids to adults), occasion (everyday to special). Pick the two that matter most to the shopper standing in front of your shelf, and keep a third and fourth for a second map if needed.
Step 3. Collect the competitor set
Eight to fifteen brands is usually enough. Take them from the actual shelf, not from a search for the category name online: the brands next to you in a store are the ones you are compared with. Include the store brand, which is often the anchor for the value end of the map, and one or two brands from adjacent shelves if shoppers consider them substitutes.
Photograph the shelf set in two or three stores. You will need the photos again when you design.
Step 4. Place the dots with data, not opinion
There are three ways to position each brand on the axes, in rising order of cost and reliability.
Team judgment, structured. Three to five people independently score each brand on each axis from 1 to 10, then compare and discuss the outliers. Cheap, fast, and biased toward how insiders see the market. Good enough for a first draft.
Proxy data. Price per ounce from shelf tags gives the price axis without any opinion at all. For the other axis, count signals on the pack: number of certifications, presence of a window, ingredient-list length, claims used. Reviews on retailer sites and Amazon are a free source of the words buyers use for each brand, and the words map to axes.
Shopper research. A short survey asking category buyers to rate brands on the two attributes, or a card-sort where they group packs. Even a few dozen responses from real buyers will show where insiders are furthest off; treat that as a directional check, and run a larger sample before you bet a redesign on the exact position of a dot.
Whichever you use, place your own brand the same way as the others. The most common error on a positioning map is a flattering dot for the home team.
Step 5. Read the map and choose the target
Look for four things:
- Clusters. Where several brands sit together, shoppers see them as interchangeable, and price decides. Entering a cluster means a price fight.
- Gaps. An empty area may be an opening. Ask why it is empty: no demand, a technical reason (nobody can make a natural product at that price), or simply nobody has tried.
- The leader’s position. The brand with the most share usually defines what “normal” looks like on the shelf. Positions close to it borrow its meaning; positions far from it have to explain themselves.
- Your distance from your target. A short move is a refresh. A long move is a rebrand, and probably a packaging format change too.
Mark the target as a second dot and draw the arrow. That arrow is the brief.
A worked example: a dry pasta shelf
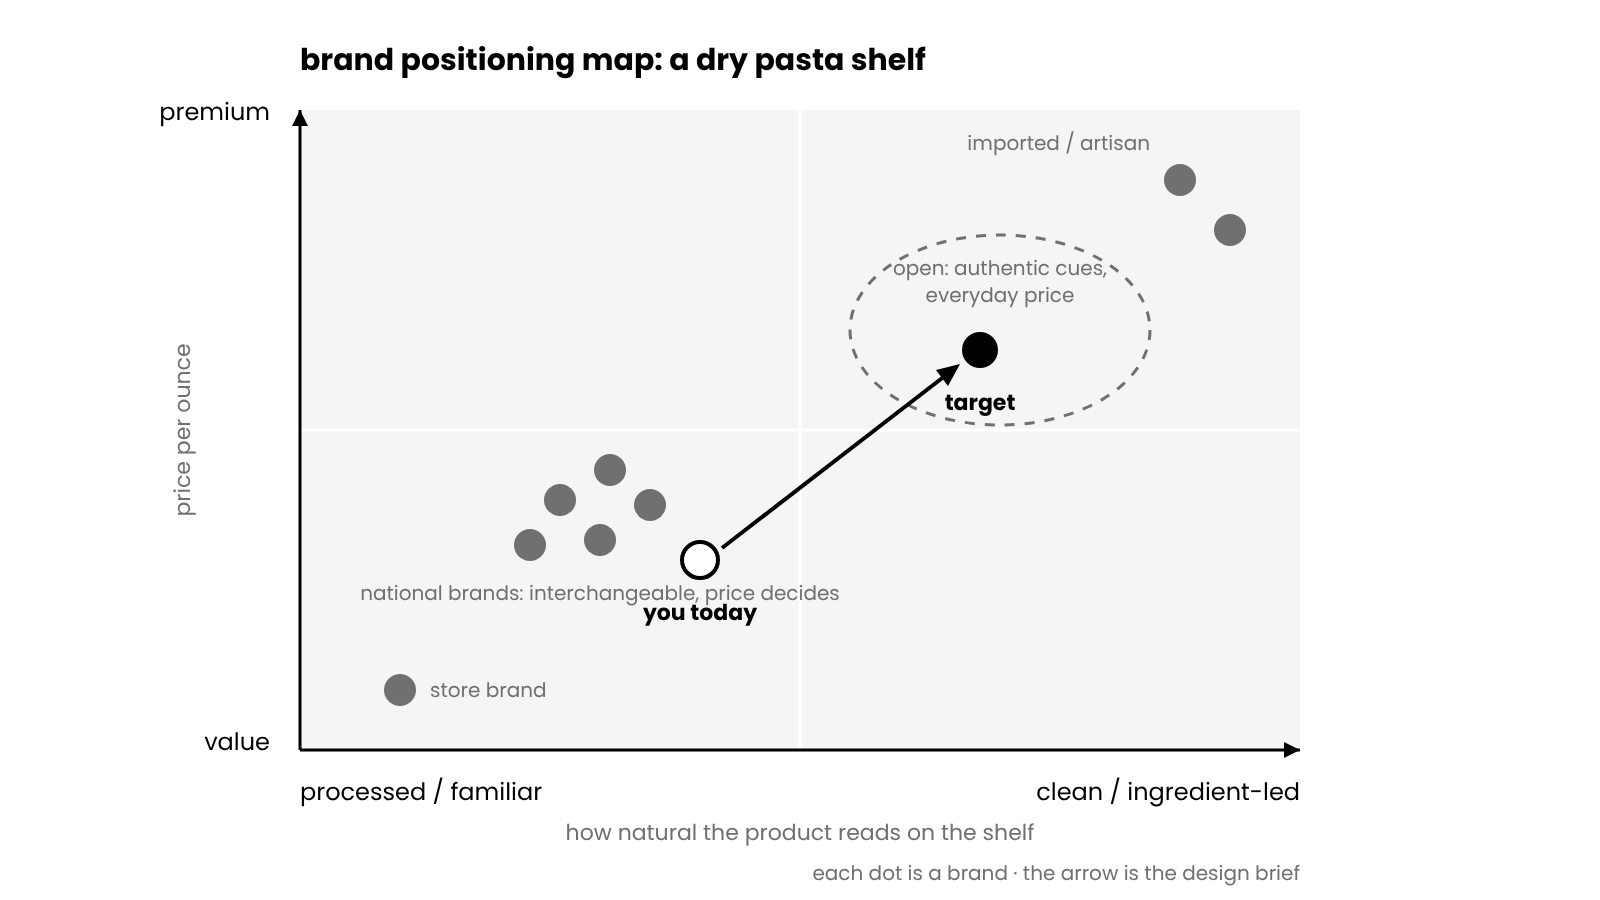
Take dry pasta, a category where most brands sit in nearly identical boxes and bags. The shopper’s trade-off is roughly price against an idea of authenticity: industrial and familiar at one end, Italian and crafted at the other.
Plotted that way, the shelf splits into a large cluster of national brands in the middle (familiar, mid-price), the store brand low and left (value, industrial), and a handful of imported brands high and right, usually in paper with Italian text and a higher price. The gap is usually in the upper middle: authentic cues at a price that does not scare a weekly shopper.
When we designed Bel Gusto, that was the target. The pack had to read as authentic Italian from the color, the type, and the kraft texture, while a viewing window kept the product itself in plain sight for a buyer who still compares pasta by what is in the bag. Naming that trade-off at the start meant the design did not have to discover it in round three.
Positioning map examples by category
The axes change with the aisle. Four pairs we see most often in packaging projects:
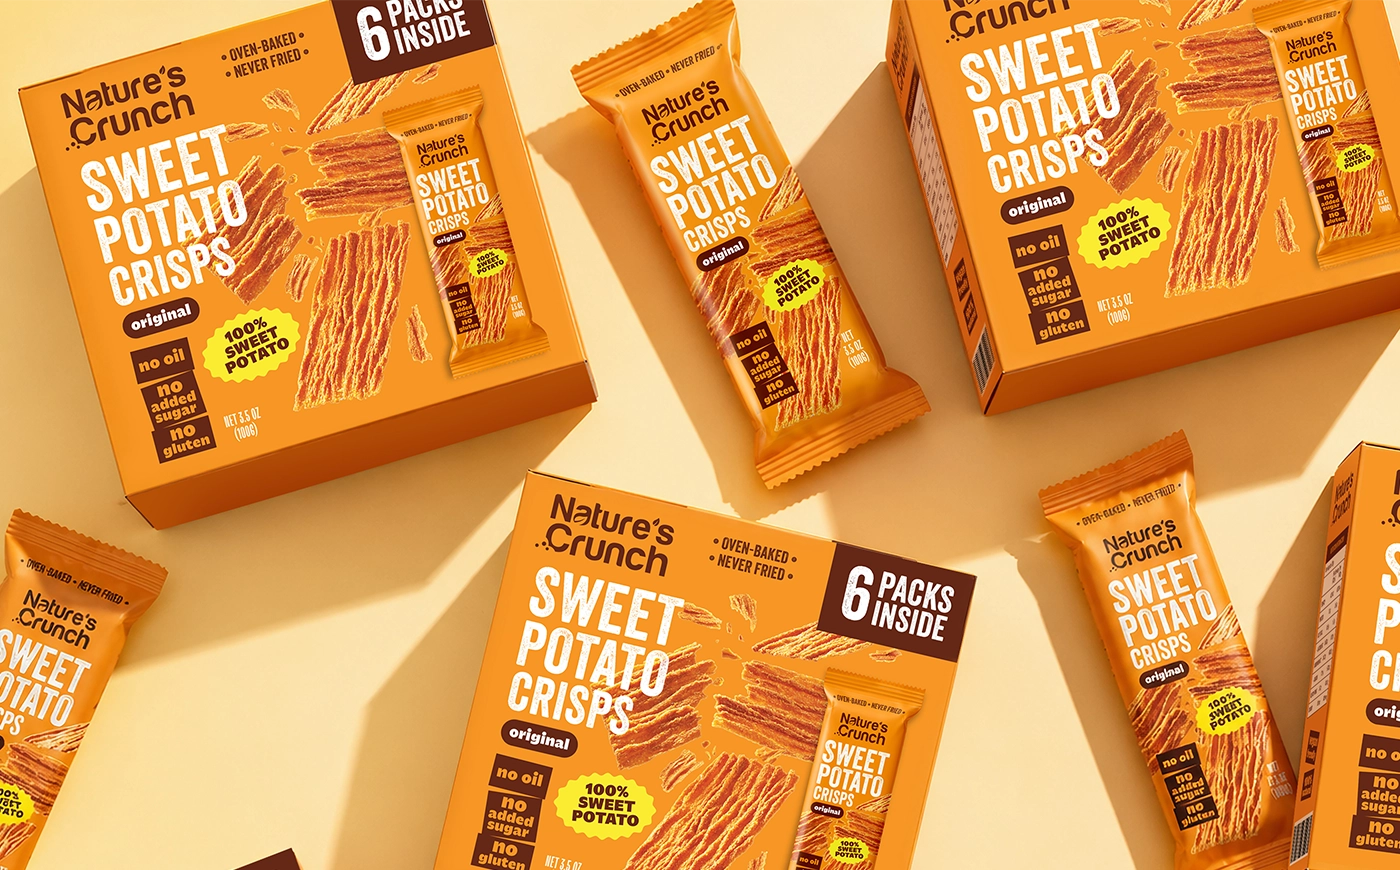
Snacks: better-for-you against indulgent, and everyday against premium. The big cluster is indulgent and everyday. Better-for-you brands have crowded the upper half over the past decade, so the open space is now often “indulgent and premium” or “better-for-you at an everyday price.” Nature’s Crunch sits on that line: vegetable crisps that had to signal real vegetables from the shelf without the muted, worthy look that keeps indulgent shoppers away, in a bright five-flavor system a regular snack buyer would reach for.
Coffee: everyday against specialty, and familiar against adventurous. Grocery coffee clusters in familiar and everyday; the specialty end is full of small roasters with similar kraft bags and origin stories. A position worth having is often “specialty quality with everyday confidence,” which on a pack means craft cues with a clear, unfussy flavor description.
Pet food: science against natural, and value against premium. Vets and ingredients have long pulled in opposite directions on this shelf, and many brands now try to claim both. On a pack that works only if one of the two leads; a design that gives them equal weight tends to read as neither.
Skincare: clinical against botanical, and simple against ritual. A white tube with a numbered formula and a green jar with leaves are the two poles, and both are crowded. Many newer brands sit in the middle on purpose, with minimal design and ingredient transparency, which was open a decade ago and is now its own cluster.
In every case the map tells you where the crowd is. It does not tell you to avoid it; sometimes the crowd is where the money is, and the job is to stand out inside it on execution.
Using the map for a line extension
When a brand adds a product, the new SKU gets its own dot. Two questions decide where it goes. Should the extension sit next to the parent, so the brand reads as one block on the map and the shelf, or should it reach into a new area the parent cannot credibly occupy, such as a premium tier or a kids’ version? The first is a packaging system question: the new pack inherits the position and needs only a variant code. The second is a sub-brand question: the new pack keeps the parent’s identity but shifts the cues, and the brand book has to say how far it may shift.
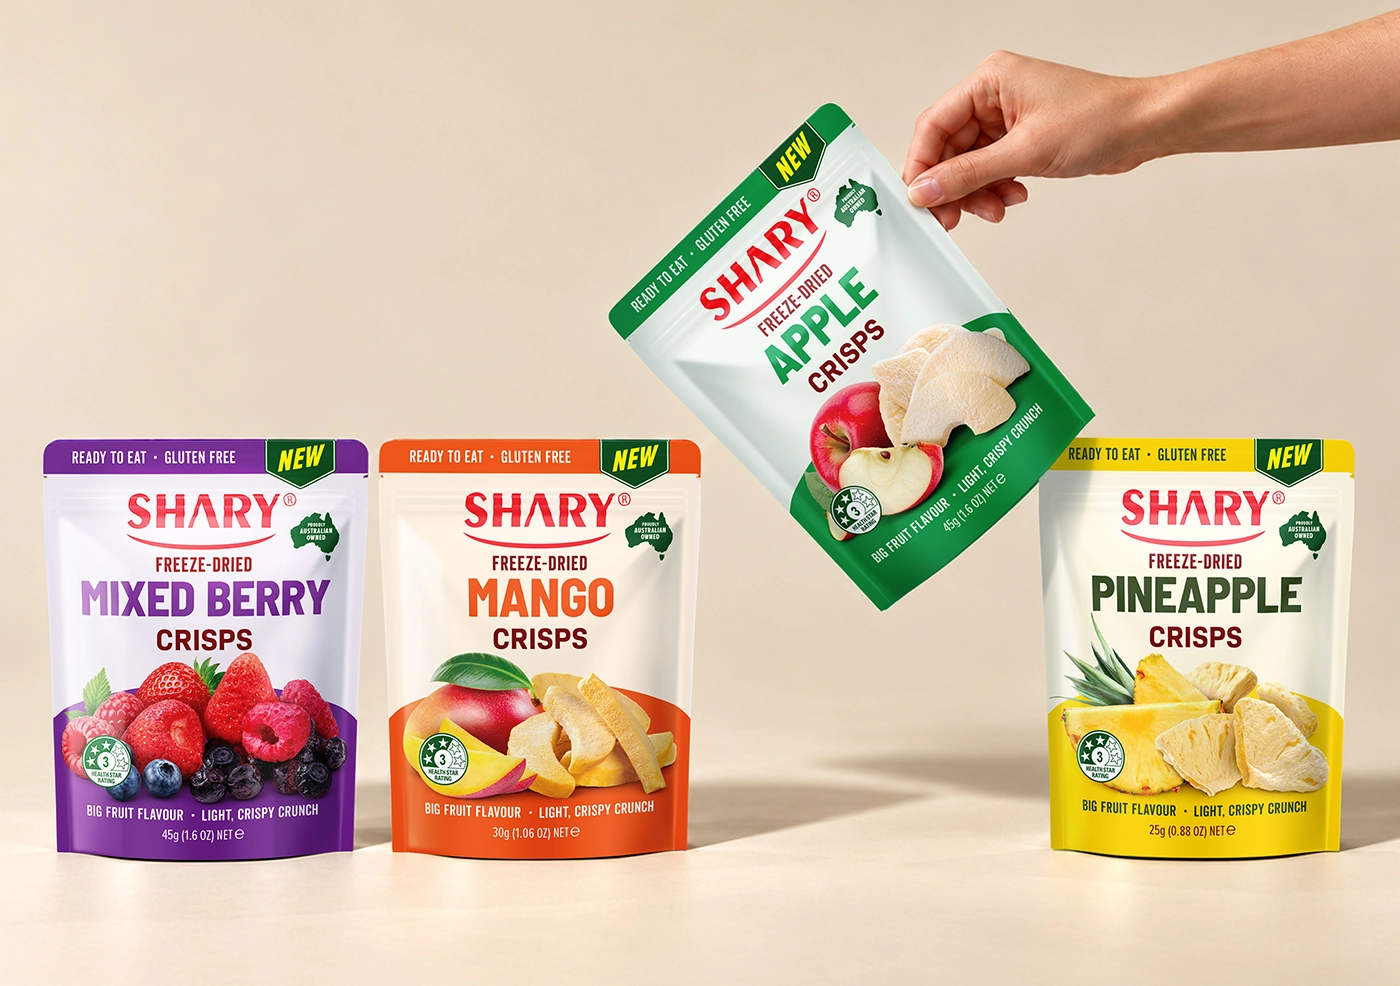
The SHARY freeze-dried fruit crisps range is the first kind: seven flavors that all sit on the parent’s dot, bright, fruit-led, everyday, and the only thing that moves between them is the color code on the top and bottom panels. Drawing the parent, the extension, and the competitors on one map before the design starts settles this in an hour. Discovering it after the first concept round costs a round.
From the map to a packaging brief
A map with an arrow on it translates into brief language in a direct way. For each axis, write down what the move means on the pack.
| Move on the map | What changes on the pack |
|---|---|
| Up on price or tier | Fewer elements, more space, better materials or finishes, restrained color, smaller claims |
| Toward “natural” | Ingredient-led photography or a window, kraft or uncoated textures, plain language, certifications in a consistent place |
| Toward “bold” or “intense” | Saturated color, larger type, a strong single image, flavor named loudly |
| Toward “modern” | Simplified logo, sans-serif hierarchy, flat color, fewer decorative elements |
| Toward “heritage” | Serif or script type, crests or marks of origin, muted palette, a story on the back |
| Toward “kids” | Characters, rounded shapes, primary colors, a visible toy or activity cue |
The brief also inherits the competitor set from Step 3: name the two or three brands you must not resemble and the one or two whose cues you are borrowing. Our packaging design brief template has a section for this, and a filled-in map is the fastest way to complete it.
know where your brand should sit?
send us your map, your shelf photos and your formats: we’ll turn the position into a pack · fixed estimate in 1-2 business days
get quoteTwo maps from our redesigns
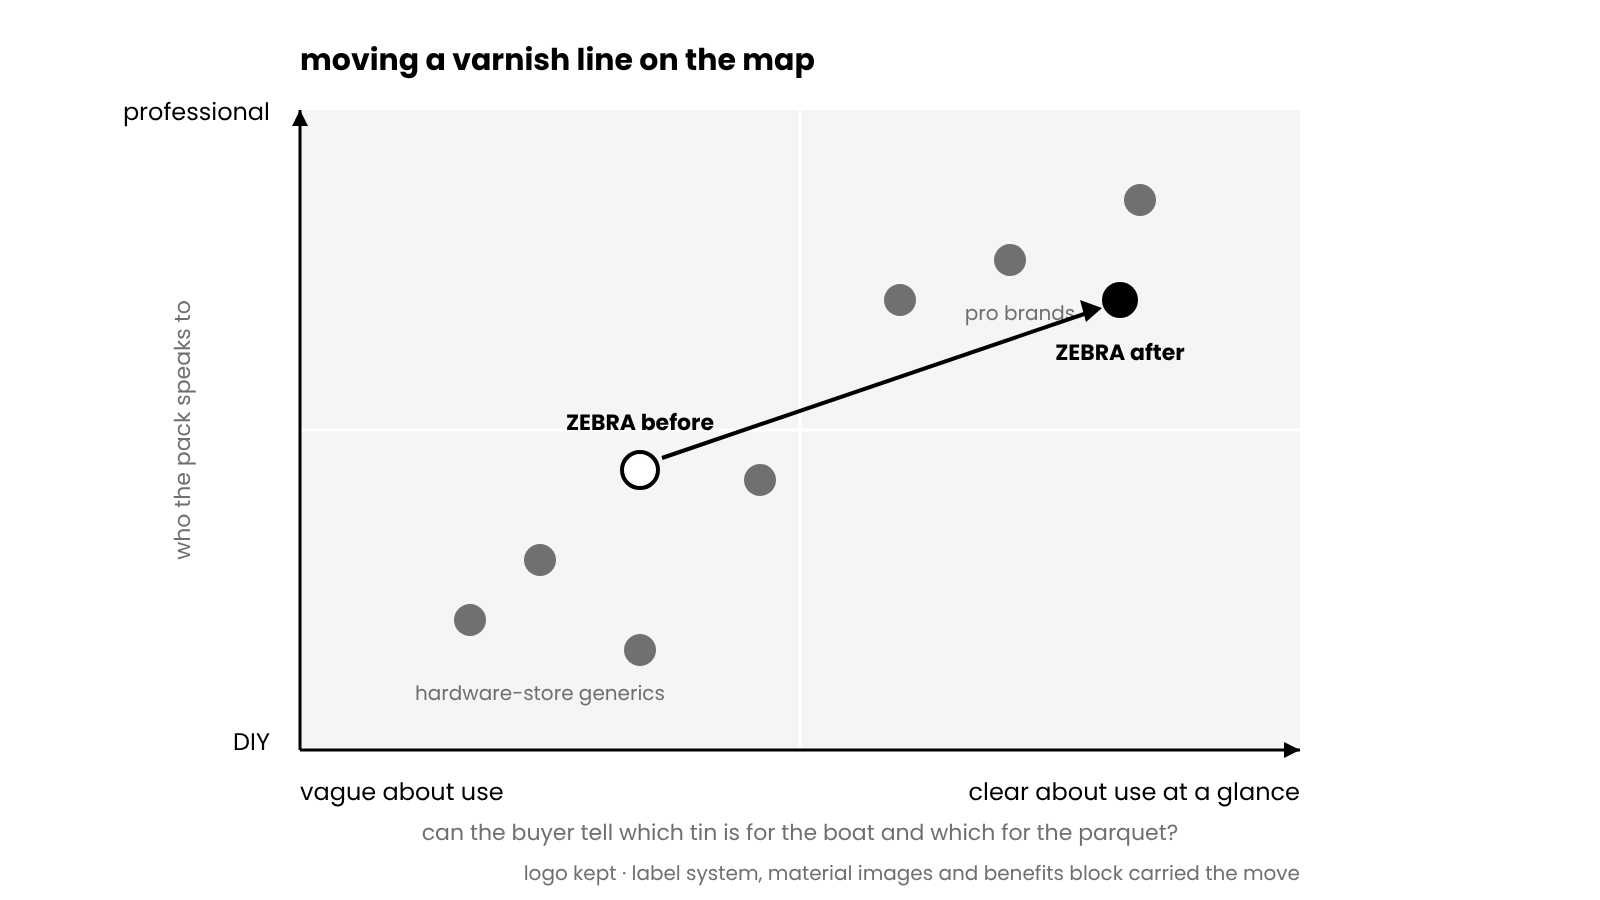
For the ZEBRA varnish line, the two axes that mattered to a shopper choosing a tin, whether a pro or a homeowner, were professional against DIY, and clear about use against vague. The old packaging sat in the middle on both: competent but dated, and not telling the buyer which tin was for a boat and which for parquet. The target was up and to the right, toward “professional” and “I can tell what this is for in a second.” The logo stayed, with higher contrast, and the move was carried by a black-and-white label structure, a material image per product (stone, wood, a boat, parquet), and a fixed four-part benefits block. Nothing about that design was a matter of taste; each element answers one of the two axes.
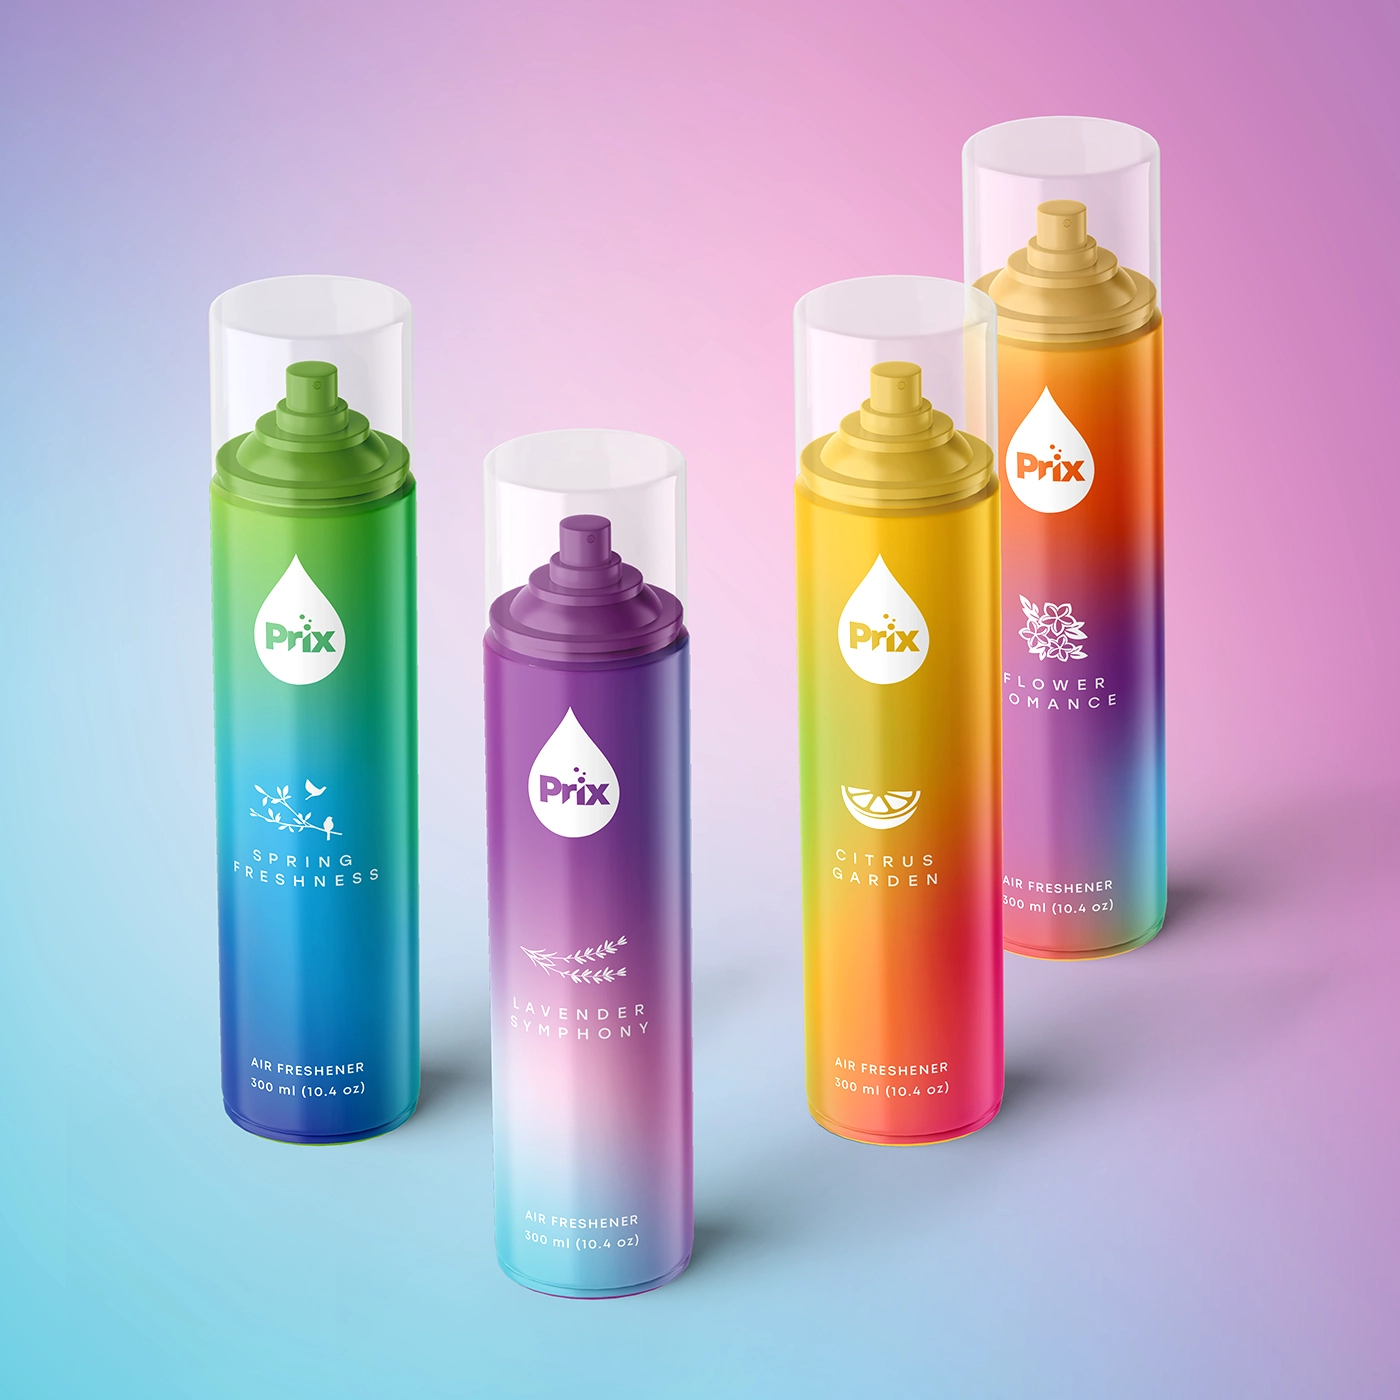
For Prix, the aerosol air fresheners had no consistent position at all, which on a map shows up as a brand with no dot: shoppers could not place it because the six scents did not look like one brand. The first job was to exist on the map. The new identity gave the range one recognizable system with a clear scent code, so the brand occupied a single, findable position instead of six accidental ones. Our collection of packaging redesign examples has more cases of brands moving their dot on purpose, and a few that moved it the wrong way.
Common mistakes
Axes that are really one axis. Price and quality, premium and natural, cheap and basic. If every brand lands on a diagonal, replace one axis.
Axes nobody shops by. “Innovative” against “traditional” is interesting to the team and invisible to a shopper choosing a jar of sauce.
Placing brands by their advertising. A brand’s own claims describe where it wants to be. The map needs where shoppers put it.
Too many brands. Thirty dots make a cloud. Keep the set to the shelf you will actually sit on.
Treating the gap as automatically good. Empty space with no demand behind it is a place to go out of business quietly. Check that buyers want what the gap offers.
Stopping at the map. A map that stays in a deck changes nothing. It has to become a brief, a design, and a pack on a shelf, and then a second map a year later to see whether the dot moved.
How often to redraw it
Once a year for most brands, and always before a redesign, a major line extension, or a move into a new channel. Categories drift: a position that was distinctive three years ago may now be the cluster. If your brand is adding products, our guide to line extension vs brand extension explains how a new SKU can sit near the parent on the map or deliberately far from it, and what each choice does to the packaging system.
What positioning work costs with us
A positioning map is part of the discovery stage in a brand identity project and is usually built with the client during the brief, with no separate line in the estimate. Where the map calls for a new look, brand identity at our agency starts at $5,000 (what that package includes is in our guide to what’s in a branding package), and packaging design starts at $2,500 for a system and about $800 for each added SKU; the full ranges are in our packaging design cost guide.
SOTDESIGN is a packaging and branding agency in New York. Over 10+ years we have designed 80+ packaging projects for consumer brands, and every one of them started with a version of the question this map answers. Design only; files go to your printer or manufacturer. Once the map is drawn and the target is clear, a packaging design company can turn it into a shelf-ready pack; that is the work we do at SOTDESIGN.
ready to move your brand on the shelf?
brief us with your map and formats · design only, files for any printer · fixed estimate in 1-2 business days
get quoteFAQ
01 What is a brand positioning map?
A two-axis chart that plots competing brands by the two attributes shoppers weigh most in a category, so you can see clusters, gaps, and where your own brand sits and should sit.
02 What is the difference between a positioning map and a perceptual map?
A perceptual map is drawn from customer perception data and describes the market as buyers see it. A positioning map uses the same chart to decide where a brand should go. In practice one chart does both.
03 What axes should I use on a positioning map?
Two attributes that shoppers trade off in your category and that do not move together. Price against a non-price attribute such as naturalness, intensity, or convenience is a common start for food and drink.
04 How many competitors should be on the map?
Eight to fifteen, taken from the actual shelf where your product will sit, including the store brand.
05 How do I get data for a positioning map?
Start with structured team scoring, add shelf prices and pack signals as proxies, and if the decision is expensive, run a short survey of category buyers. Place your own brand the same way as the others.
06 How does a positioning map help with packaging design?
It converts a vague goal into a direction: which brands to move away from, which cues to borrow, and what the move means for color, type, structure, and claims. That becomes the packaging brief.
07 How often should I update it?
Yearly, and before any redesign, major line extension, or new channel.