Foods With Red Dye 40 and Red 3: What 460,275 US Food Labels Show
Red Dye 40 is most common in candy, gelatin desserts, liquid water enhancers, cake decorations, chewing gum, snack cakes, powdered drink mixes, and soda. We checked the ingredient lists of 460,275 unique US packaged foods in the USDA Branded Foods database, and 38,875 of them (8.4%) list Red 40. That makes it the most widely used synthetic dye in the data. In candy, 57.4% of products list it. In gelatin desserts the share is 57.6%, and in sprinkles and other baking decorations it is 40.6%.
Red No. 3, the dye FDA has banned in food from January 15, 2027, appears on 9,406 product records in the same database. More than a quarter of baking decorations list it, and so do 13.2% of candies.
This is the first SOTDESIGN Food Label Report. We are a packaging and label design agency, so we read the data the way a brand team would: what is printed on the pack, and what will have to change. The report covers seven synthetic dyes, the length of ingredient lists, how many names for sweeteners a single label uses, and the claims brands put on the front of the pack. Every number comes from public data, and the method is at the end so anyone can repeat it.
Main findings
- One in eight products lists a synthetic dye. 57,505 of 460,275 products (12.5%) list at least one of the seven certified FD&C dyes. In candy, it is two in three (67.6%).
- 9,406 product records list Red 3. That is 2.0% of all products, with the federal deadline for food about two months away. In baking decorations, it is 26.2%.
- About one in eight products lists three or more sweeteners. Sugar, corn syrup, dextrose, and other names add up: 12.4% of products list three or more. In snack cakes and cupcakes, more than half do.
- “Gluten-free” is the most common label claim. Among US products in Open Food Facts with at least one recorded label, 34.8% carry it, ahead of organic (22.9%) and non-GMO (22.2%).
- By share, “natural” in a product name is most frequent on water. 12.2% of water products use it, mostly in standard names such as natural spring water.
Which foods contain Red Dye 40
Red 40 sits in the products people expect, and the gap between categories is wide. Here are the 12 categories with the highest share, among those with at least 700 products in the database:
| Category (USDA) | Products | List Red 40 |
|---|---|---|
| Gelatin, gels, pectins & desserts | 931 | 57.6% |
| Candy | 23,168 | 57.4% |
| Liquid water enhancers | 787 | 40.9% |
| Baking decorations & dessert toppings | 4,221 | 40.6% |
| Chewing gum & mints | 1,716 | 31.6% |
| Cakes, cupcakes, snack cakes | 9,510 | 27.3% |
| Confectionery products | 1,037 | 25.6% |
| Powdered drinks | 4,457 | 23.5% |
| Soda | 8,230 | 21.2% |
| Croissants, sweet rolls, muffins & pastries | 2,896 | 21.0% |
| Sport drinks | 788 | 20.6% |
| Cookies & biscuits | 13,648 | 17.6% |
Further down the list are ice cream and frozen yogurt (14.4%), cereal (11.1%), chocolate (9.6%), and chips, pretzels, and snacks (7.2%). Across all categories, 8.4% of products list Red 40.
Some single products stand out in the data. Of the 246 products with “maraschino” in the name, 204 (83%) list Red 40. Ketchup is the opposite: of 906 products with “ketchup” in the name, only 14 list it, and most of those are ketchup-flavored snacks. A red product does not always contain a red dye.
How Red 40 appears on a label
A certified color has to be named in the ingredient list. FDA rules allow the short form, so “Red 40” is enough, and a lake (a water-insoluble form of the dye made on an aluminum base, used in fats, coatings, and dry mixes) is written as “Red 40 Lake” (21 CFR 101.22(k)). The names we searched for:
- Allura Red AC, the chemical name
- FD&C Red No. 40, Red 40, Red 40 Lake
- E129, the code used in Europe and on some imported products
A color that is exempt from certification, such as beet juice or spirulina extract, can be declared by its name or with a phrase such as “color added”. So a product without Red 40 can still have an added color on its label, under a different name.
All seven synthetic dyes, ranked
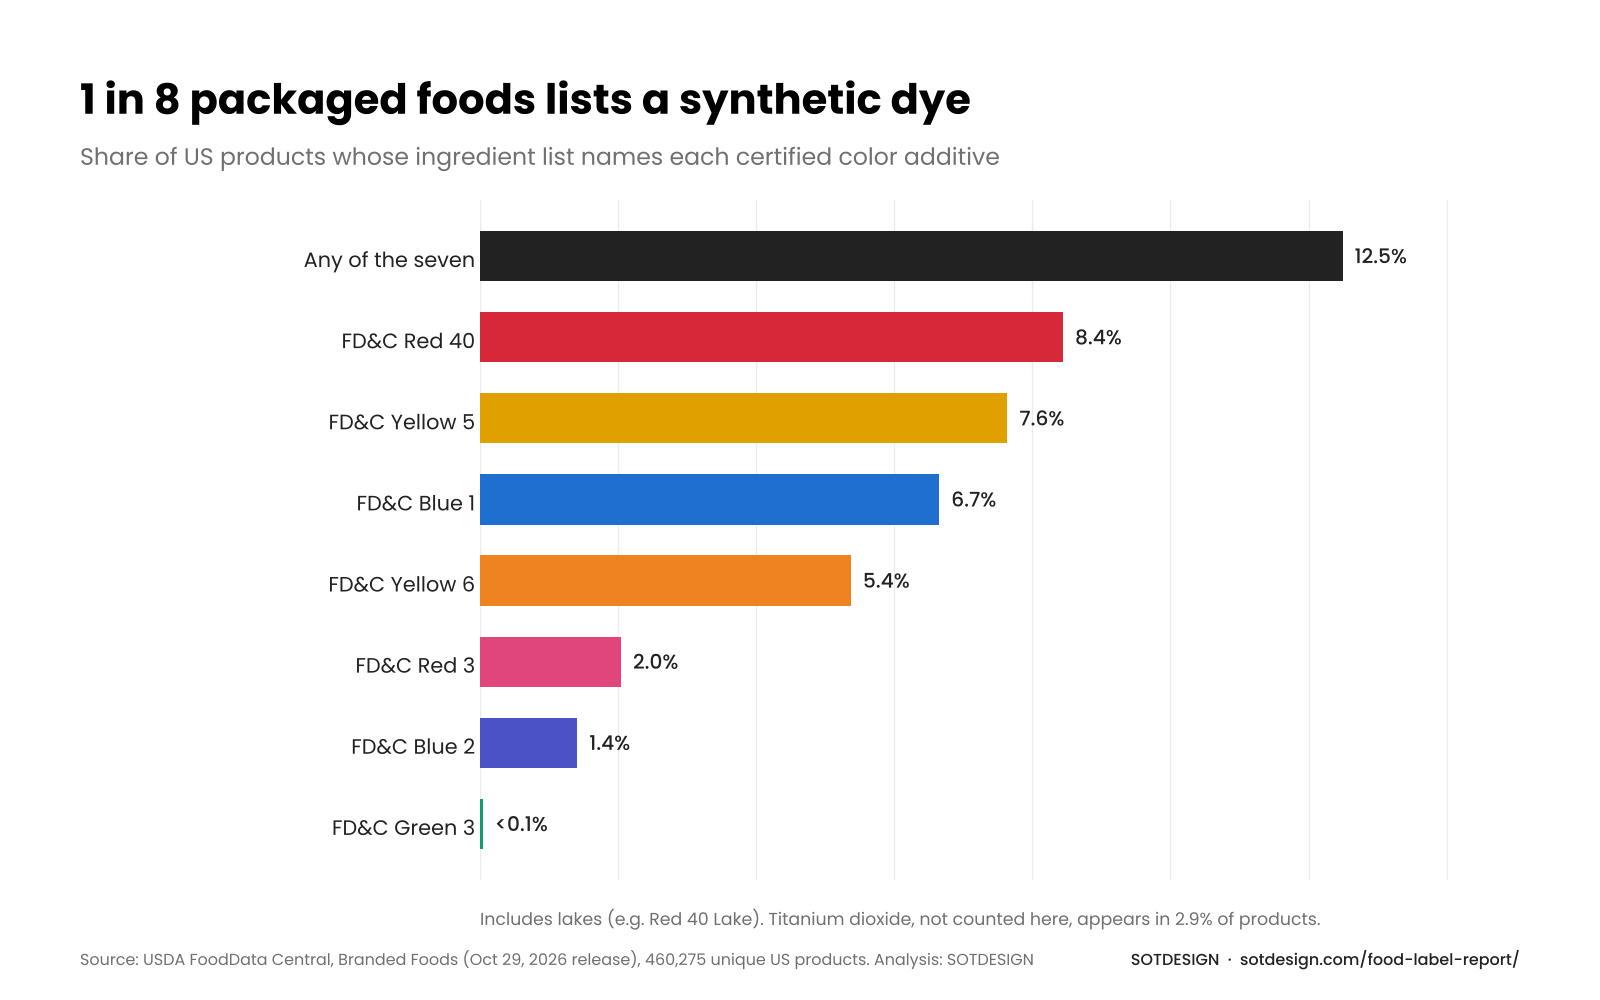
Seven synthetic dyes are certified for general use in US food. Here is how often each appears in the data:
| Dye | Also listed as | Products | Share |
|---|---|---|---|
| Red 40 | Allura Red AC, E129 | 38,875 | 8.4% |
| Yellow 5 | Tartrazine, E102 | 35,159 | 7.6% |
| Blue 1 | Brilliant Blue FCF, E133 | 30,621 | 6.7% |
| Yellow 6 | Sunset Yellow FCF, E110 | 24,736 | 5.4% |
| Red 3 | Erythrosine, E127 | 9,406 | 2.0% |
| Blue 2 | Indigo carmine, E132 | 6,489 | 1.4% |
| Green 3 | Fast Green FCF, E143 | 185 | under 0.1% |
| Any of the seven | 57,505 | 12.5% |
Dyes are usually used together. Yellow 5 and Blue 1 make green; Red 40 with Blue 1 makes purple. That is why the shares above add up to far more than 12.5%: one bag of mixed candy can list five of them.
We also counted titanium dioxide, a white color used for opacity in candy coatings, frostings, and decorations. It is not a certified dye in the US system, so it is not in the seven. It appears on 13,174 labels (2.9%). The European Union stopped allowing it as a food additive in 2022, which matters for brands that sell in both markets.
Red No. 3: the dye with a deadline
FDA revoked the authorization of FD&C Red No. 3 in food and ingested drugs in January 2025. Food manufacturers have until January 15, 2027, and makers of ingested drugs until January 18, 2028 (FDA: FD&C Red No. 3). FDA based the decision on the Delaney Clause of the Federal Food, Drug, and Cosmetic Act, which bars approval of a color additive shown to cause cancer in people or animals, and said the way Red 3 causes cancer in male rats does not occur in humans. In August 2026, FDA denied the objection and hearing request filed against the order and confirmed both dates (Federal Register). California’s own ban on Red 3 in food, from the California Food Safety Act, also starts on January 1, 2027 (AB 418). The other rule changes that reach the pack next year are in our packaging trends for 2027.
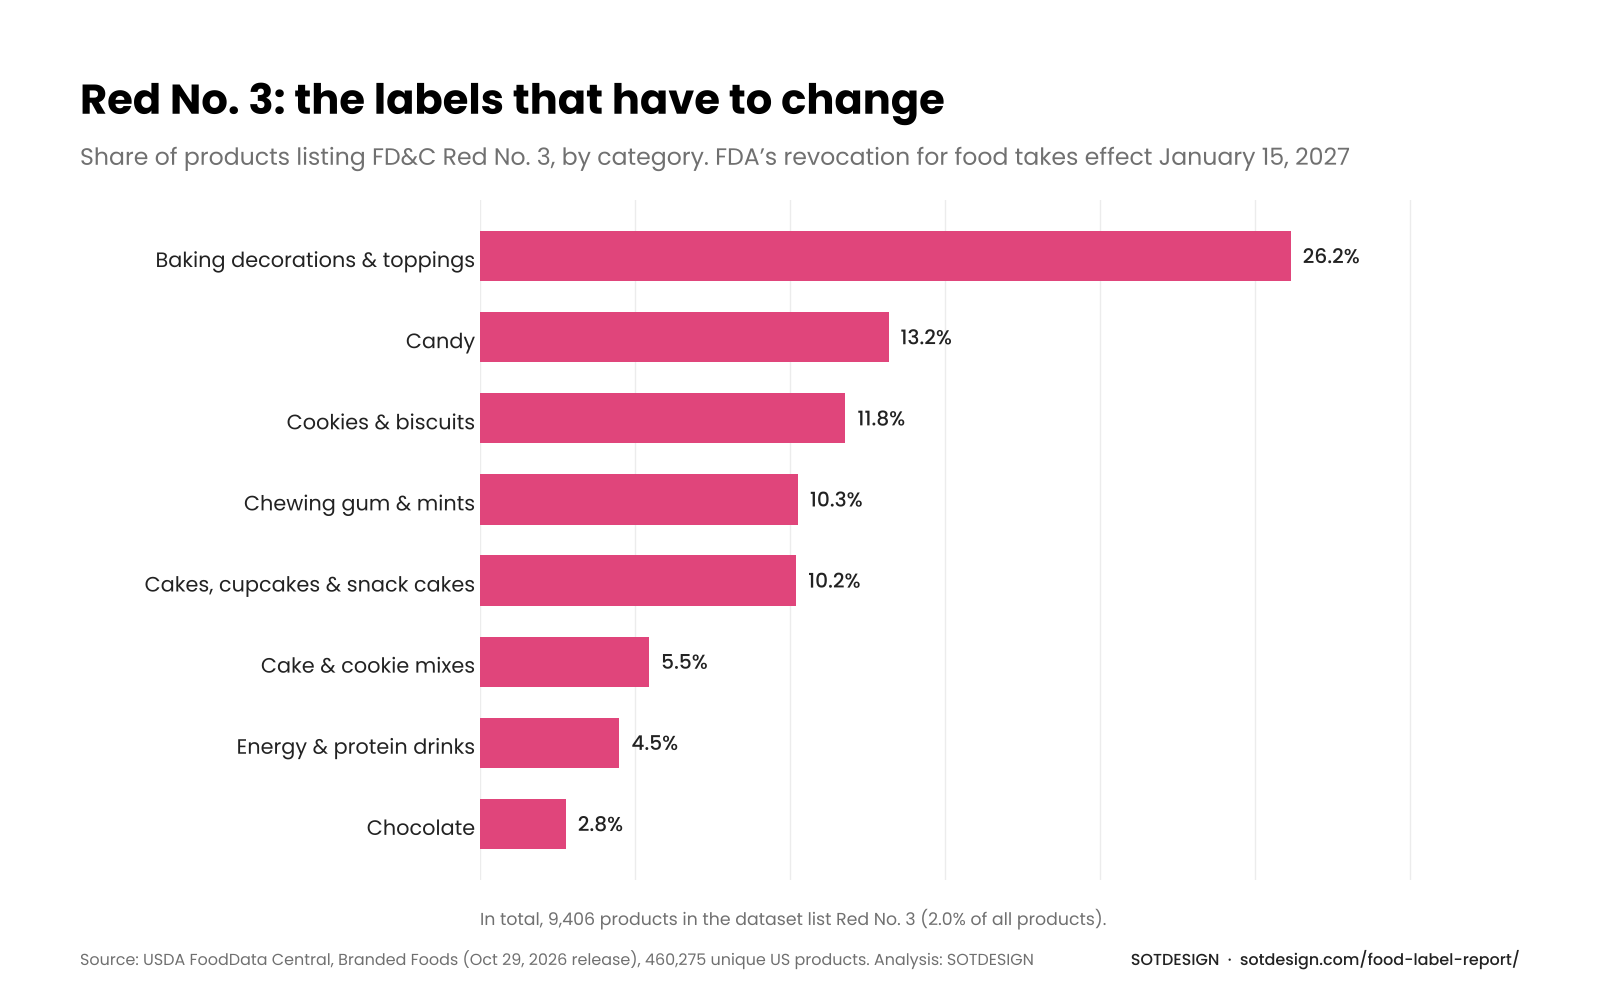
Red 3 gives a bright cherry red with a pink cast that is hard to match with natural colors, and its use is concentrated in a few categories:
| Category (USDA) | Products | List Red 3 |
|---|---|---|
| Baking decorations & dessert toppings | 4,221 | 26.2% |
| Candy | 23,168 | 13.2% |
| Cookies & biscuits | 13,648 | 11.8% |
| Chewing gum & mints | 1,716 | 10.3% |
| Cakes, cupcakes, snack cakes | 9,510 | 10.2% |
| Cake, cookie & cupcake mixes | 3,590 | 5.5% |
| Energy, protein & muscle recovery drinks | 1,956 | 4.5% |
| Chocolate | 10,867 | 2.8% |
Many of these records were submitted before the 2025 order, and some brands have reformulated since. To see whether old records skew the numbers, we looked only at products whose most recent record is dated 2023 or later (158,097 of them). Red 3 appears on 1.99% of those, almost the same as the full set. Any synthetic dye appears on 11.9%, and in candy on 67.7%. For records dated 2024 or later, the sample is small and uses a newer category system with no records in the Candy category, so we don’t read a trend from it.
reformulating before January 2027?
we update labels and packs for the new ingredient list · fixed estimate in 1–2 business days
get quoteCandy: two in three products list a dye
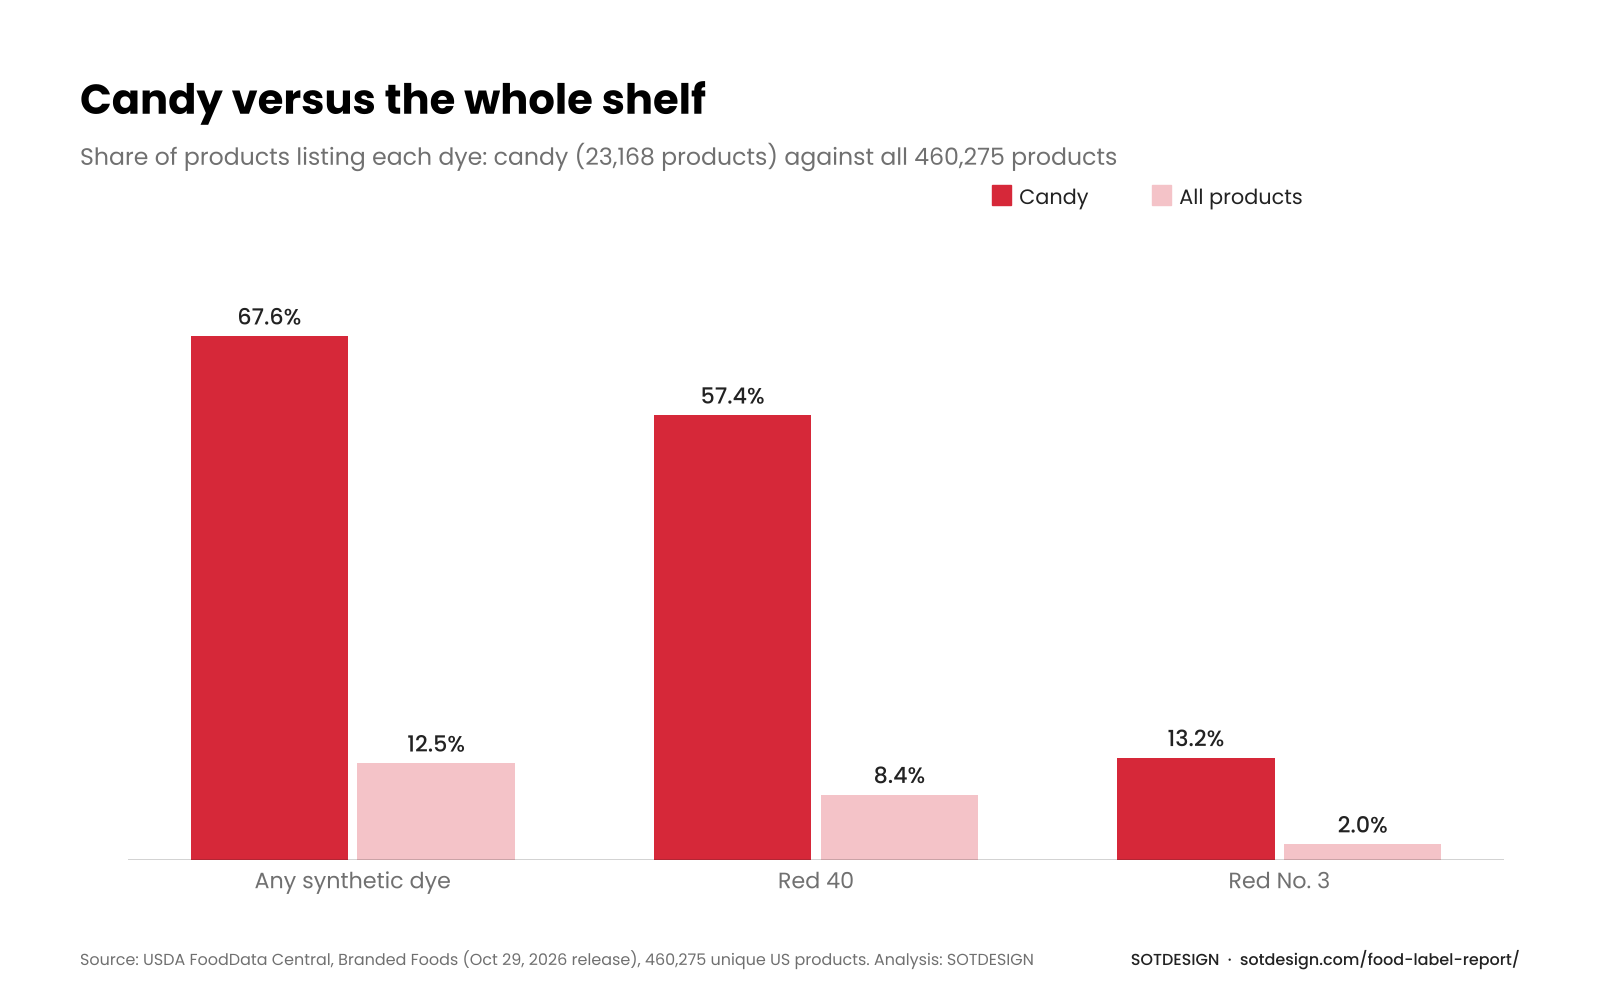
Candy is the category where dyes are the norm. Of 23,168 candy products, 15,662 (67.6%) list at least one synthetic dye, against 12.5% across the whole database. Red 40 alone is on 57.4% of candy labels, and Red 3 on 13.2%.
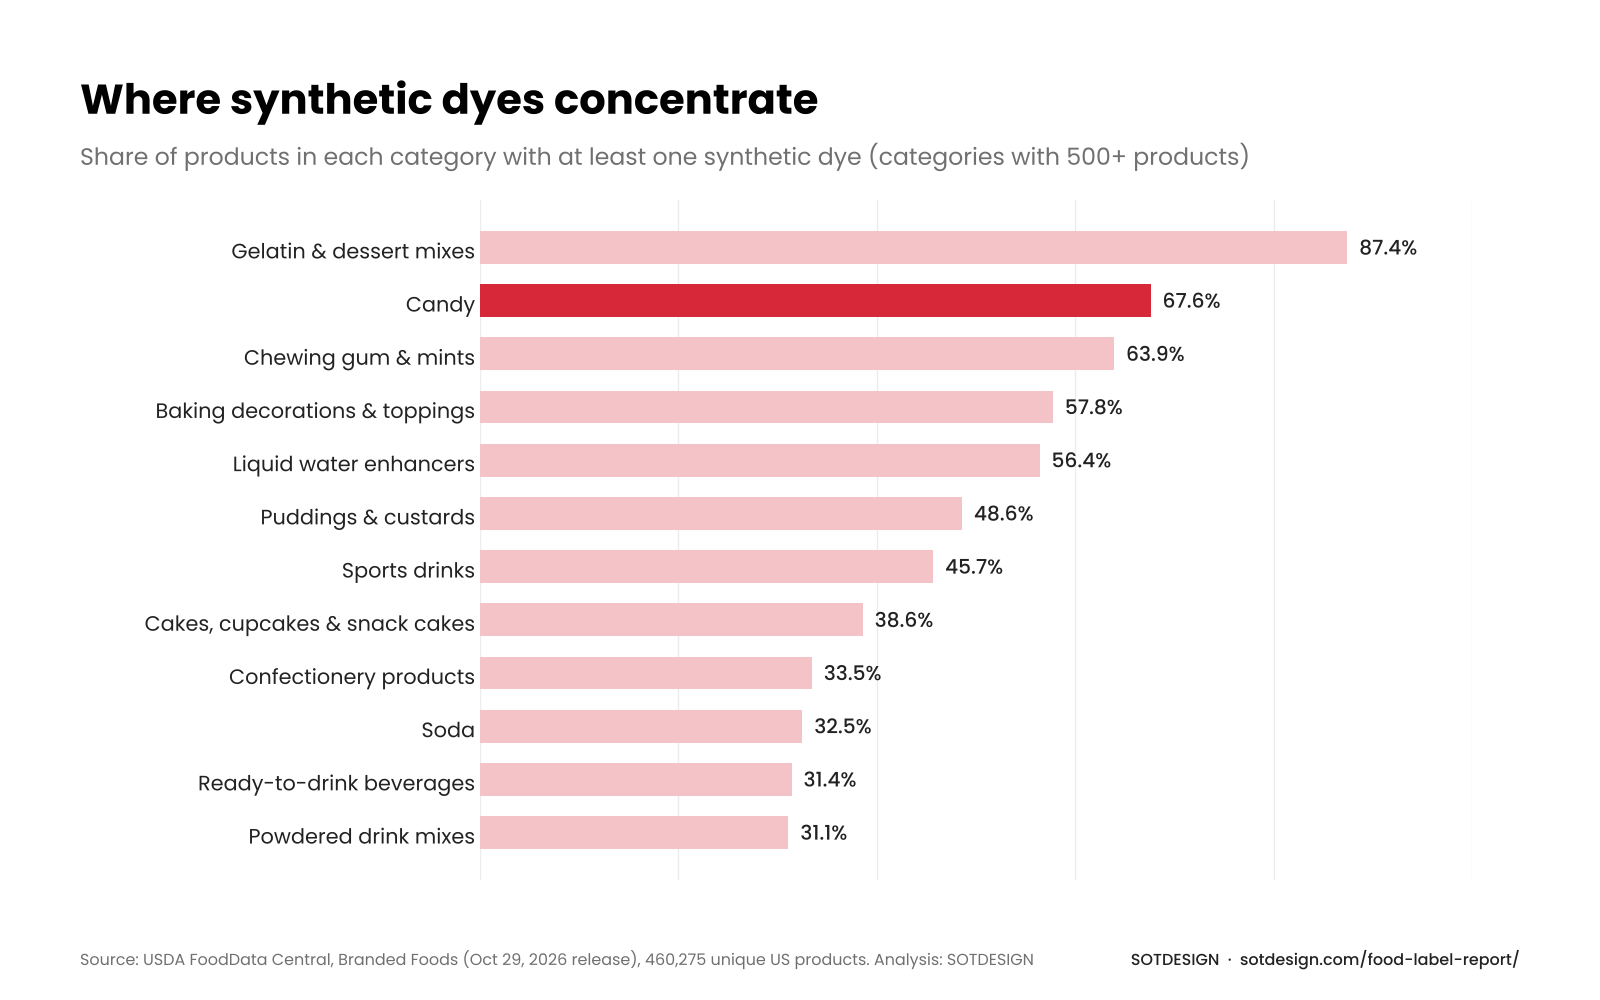
Gelatin desserts are even higher (87.4%), and chewing gum and mints (63.9%) and baking decorations (57.8%) come close. Liquid water enhancers (56.4%), puddings (48.6%), and sport drinks (45.7%) follow. In most of these the color is the product: a flavor is sold by its color, and the pack is designed around it. We wrote about flavor color codes in our candy packaging design guide.
What brands will have to rewrite
For Red 3, the change is required. Under federal rules, dropping the other six is voluntary. In April 2025, HHS and FDA announced a plan to move the US food supply away from petroleum-based dyes and asked food companies to drop the remaining six on a voluntary basis by the end of 2026 (FDA). FDA now names the end of 2027 as the target and tracks the public pledges companies have made (FDA tracker). Since 2025 it has approved new colors from natural sources, including galdieria extract blue, butterfly pea flower extract for more uses, gardenia (genipin) blue, and beetroot red. It has also given companies more room to make “no artificial colors” claims when they use colors from natural sources, and it revoked the listing of Orange B, a dye allowed only on frankfurter and sausage casings. Some states have passed their own dye and ingredient laws, and federal courts have paused enforcement of the West Virginia and Texas laws, at least in part, so the rules can still move.
For a brand with a dye in its products, reformulation reaches the package in at least four places:
- The ingredient statement. “Red 40” becomes a named natural color or “color added”. If the new color needs a carrier or a stabilizer, the line gets longer, and it has to fit the same panel.
- The product itself. Colors from beets, paprika, spirulina, or fruit and vegetable juice often give a different shade, and they react to heat, light, and acid differently. Some fade faster on the shelf, especially behind clear film.
- Photography and windows. If the product looks different, the photo on the pack must change with it. A pack that shows the old shade next to a window with the new one is a problem the shopper sees first.
- The flavor color system. Many lines use the product color as the flavor code across the range. When one flavor shifts, the system may need to shift too.
Planning the pack change with the formula change keeps the new label from arriving months after the new product.
How long is a US ingredient list?
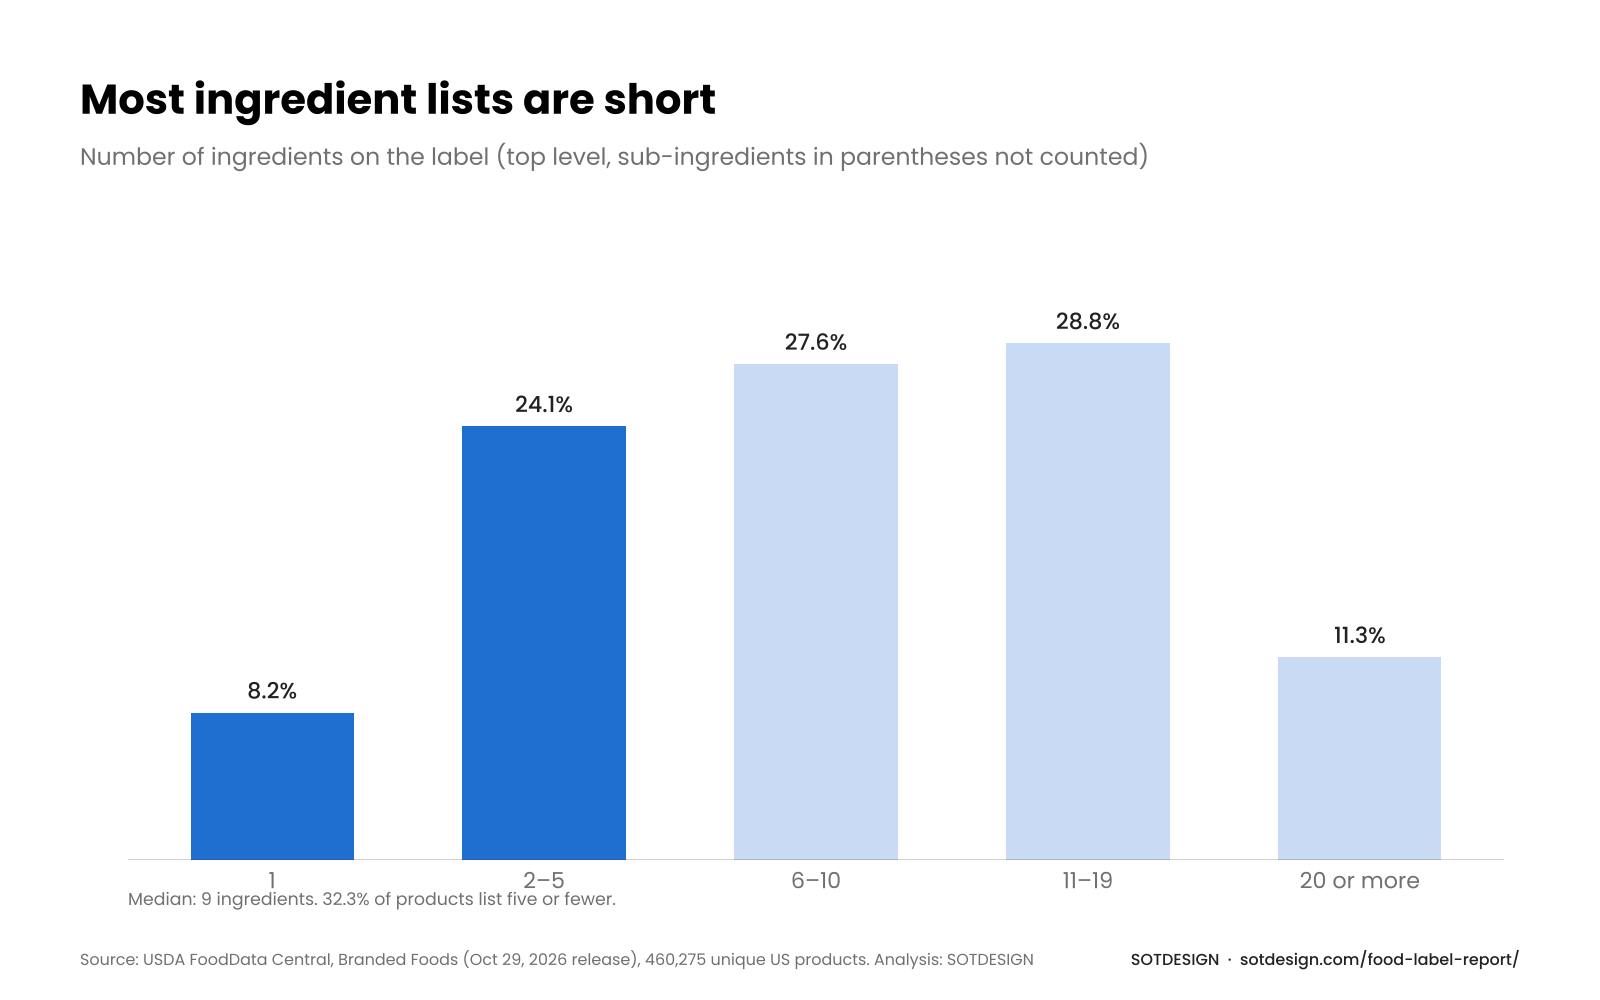
The median product in the database lists 9 ingredients. Labels are short more often than people think: 32.3% list five ingredients or fewer, and 8.2% list just one. At the other end, 11.3% list 20 or more.
Category makes a big difference:
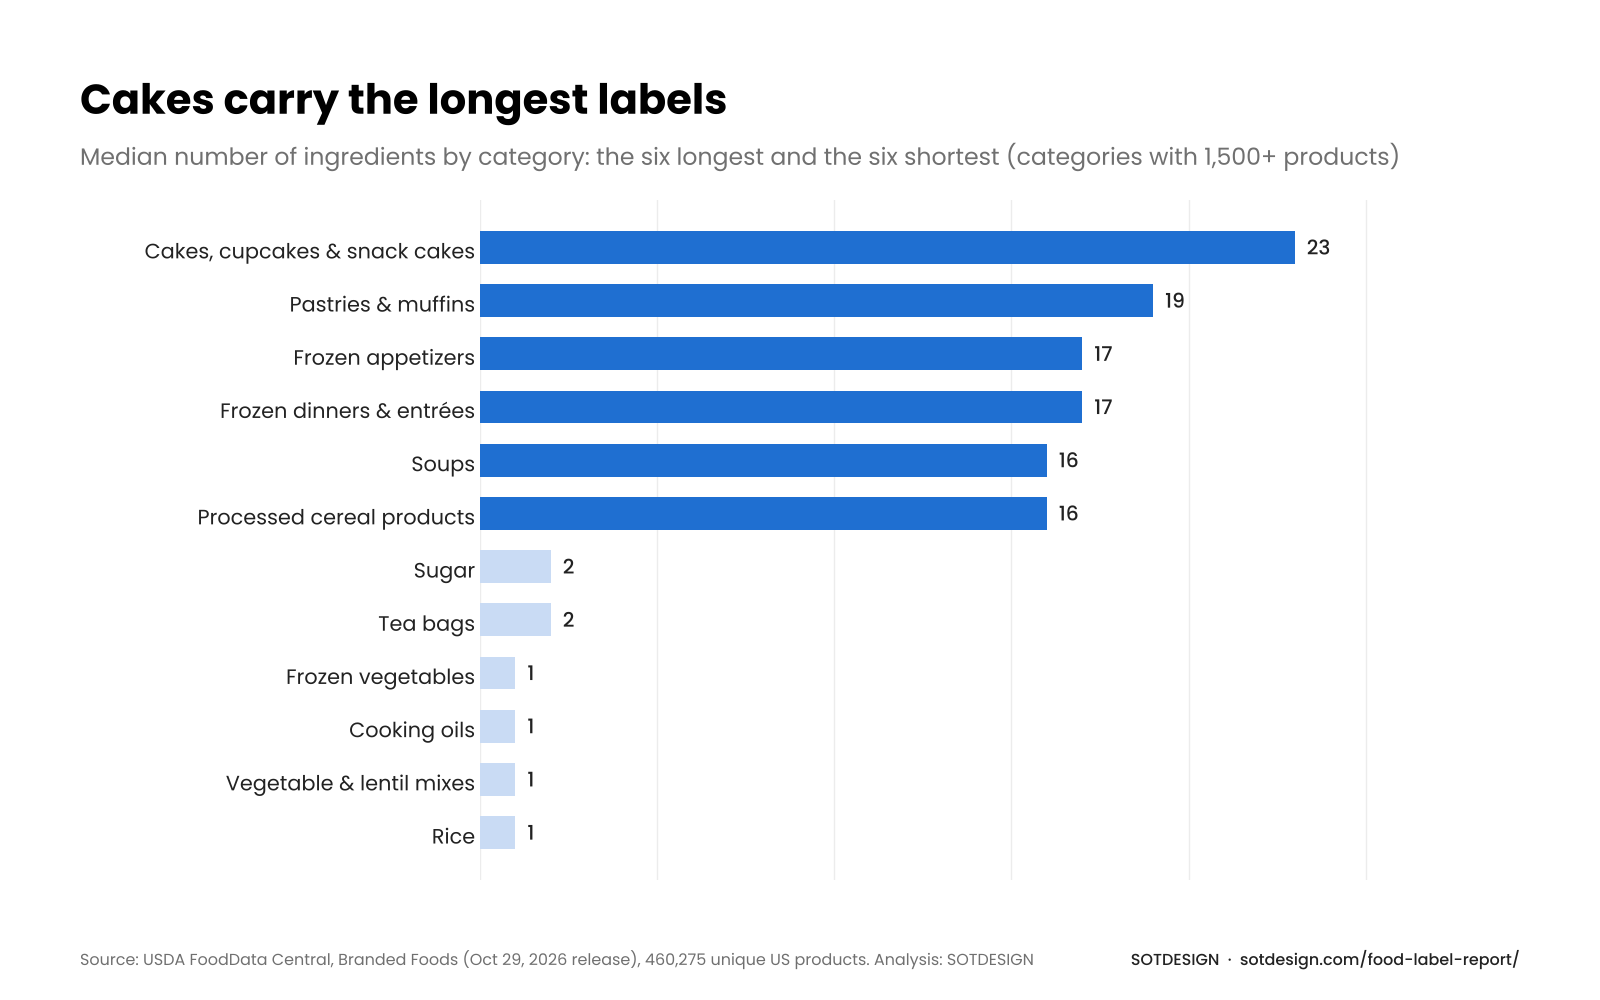
- Longest lists (median): cakes, cupcakes, and snack cakes 23; croissants, sweet rolls, and pastries 19; frozen appetizers and frozen dinners 17 each; soups and processed cereal products 16 each.
- Shortest lists (median): rice, lentil and vegetable mixes, cooking oils, and frozen vegetables, all with a single ingredient.
For packaging, a 23-ingredient list is a layout problem. Ingredients go in descending order by weight, the type on the information panel generally has a minimum size of 1/16 inch, and the list shares space with Nutrition Facts, allergens, and the name and address of the company. Our food label requirements guide covers what each panel has to carry.
How many sweeteners does one label list?
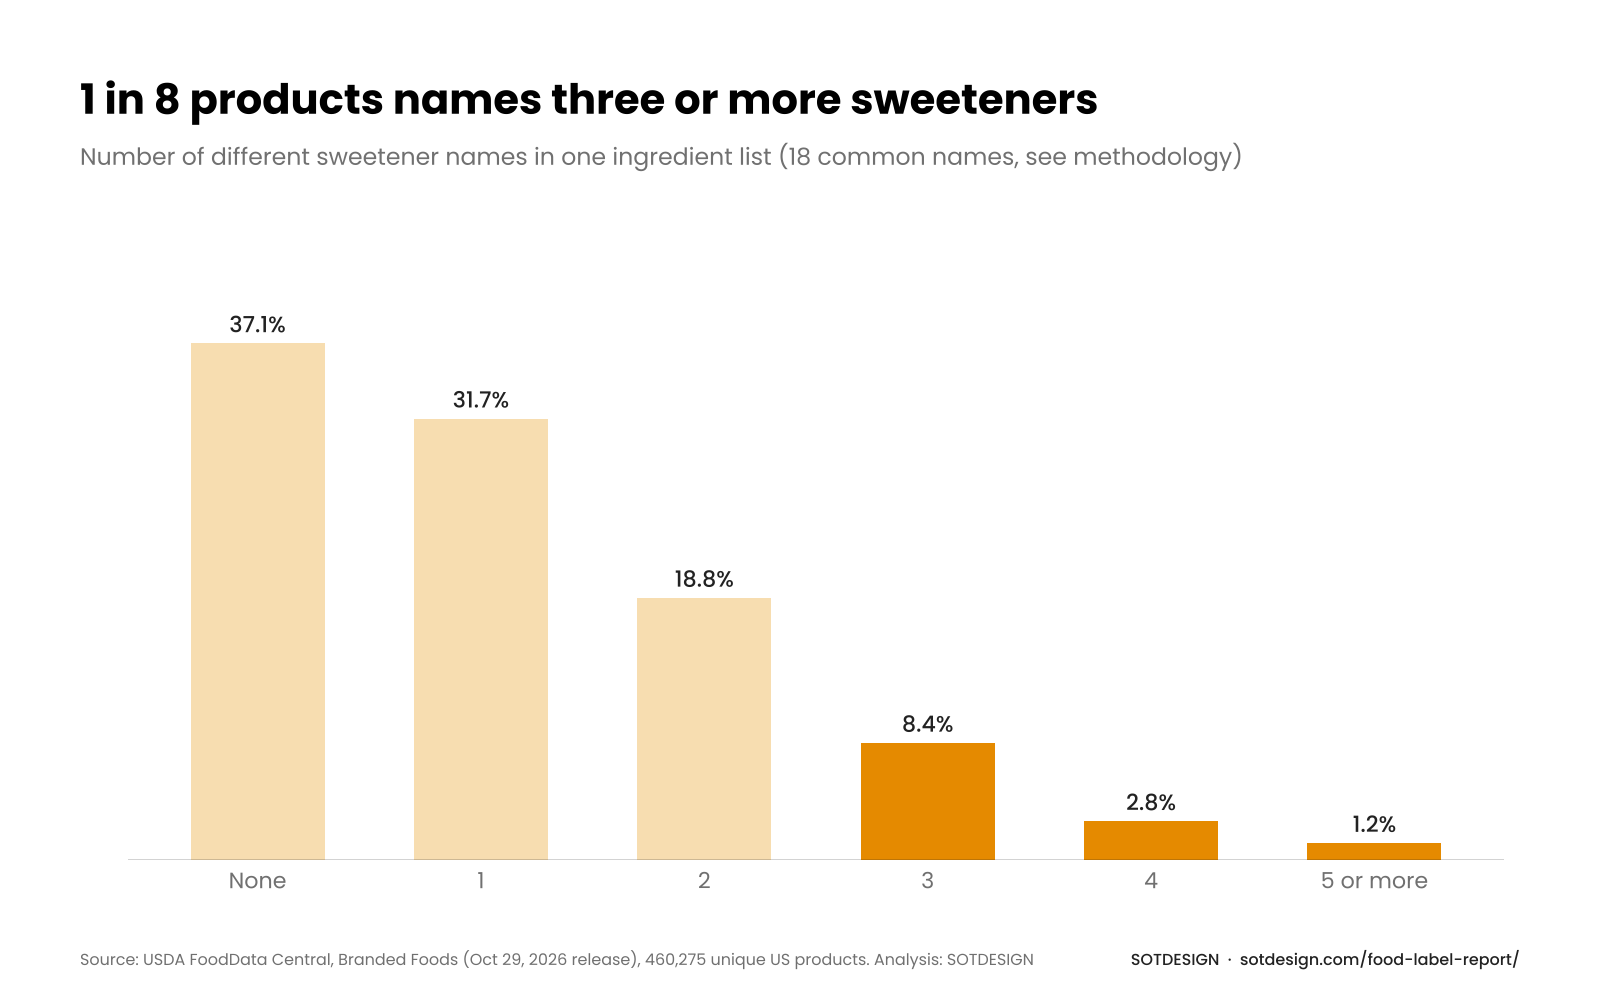
We searched for 18 names of sugars and syrups, from sugar and corn syrup to dextrose, honey, molasses, and fruit juice concentrate. 62.9% of products list at least one. 12.4% list three or more, 1.2% list five or more, and the highest count on a single label was 10.
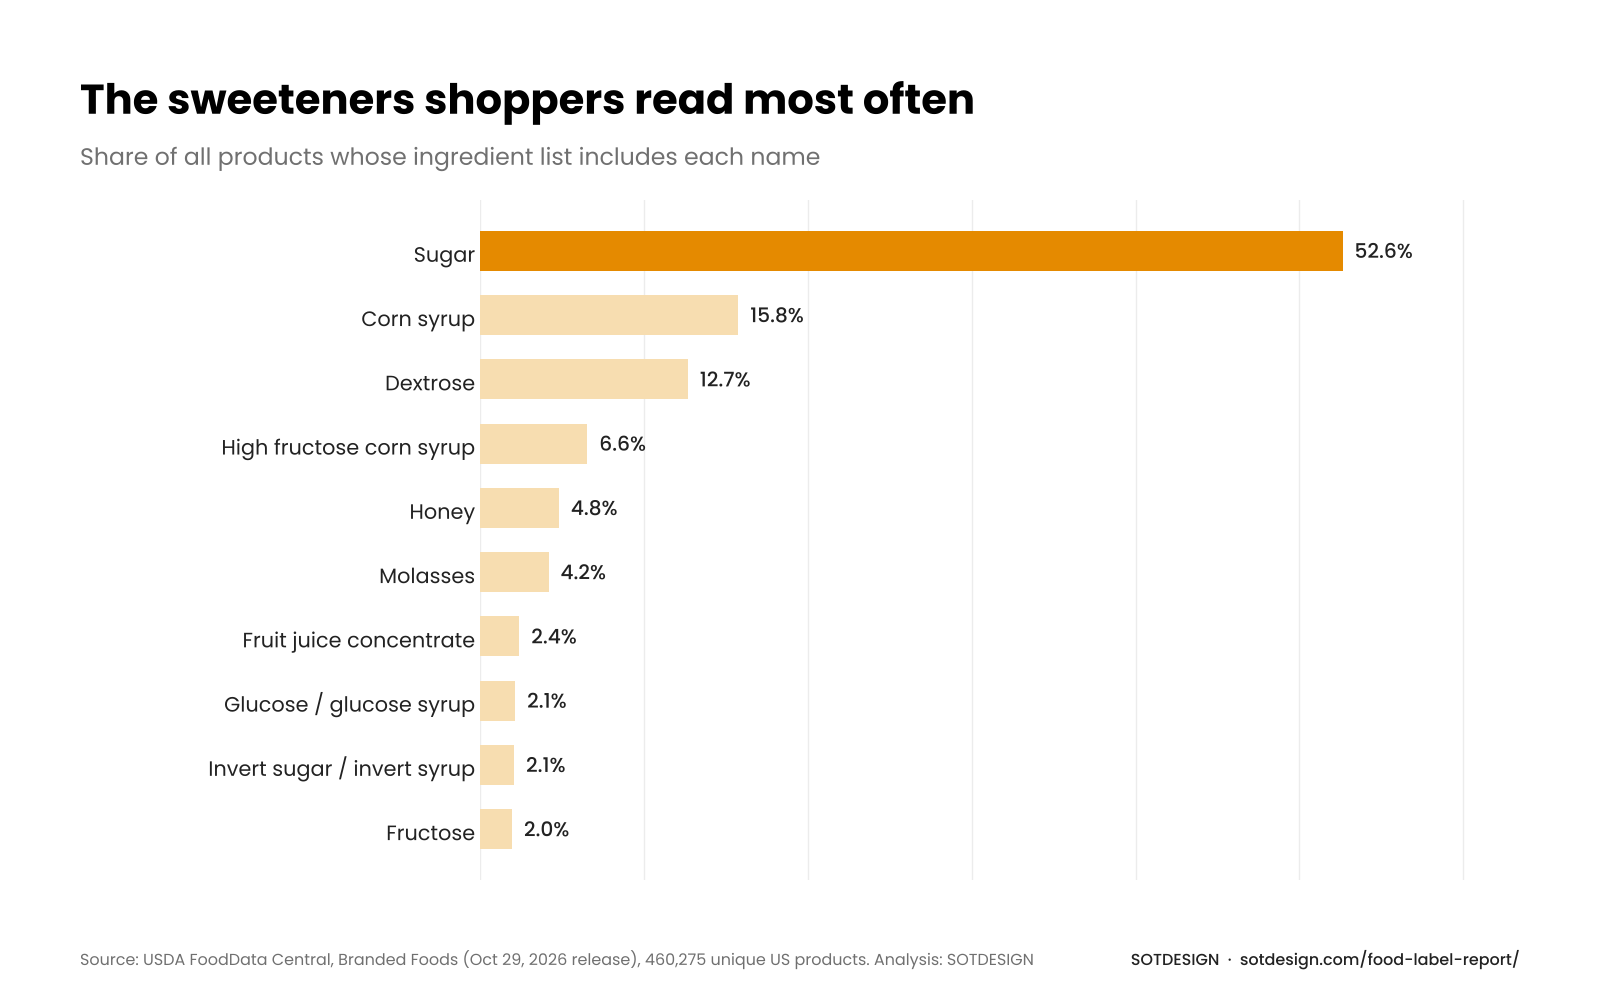
The most common names, by share of all products:
| Sweetener | Share of products |
|---|---|
| Sugar | 52.6% |
| Corn syrup | 15.8% |
| Dextrose | 12.7% |
| High fructose corn syrup | 6.6% |
| Honey | 4.8% |
| Molasses | 4.2% |
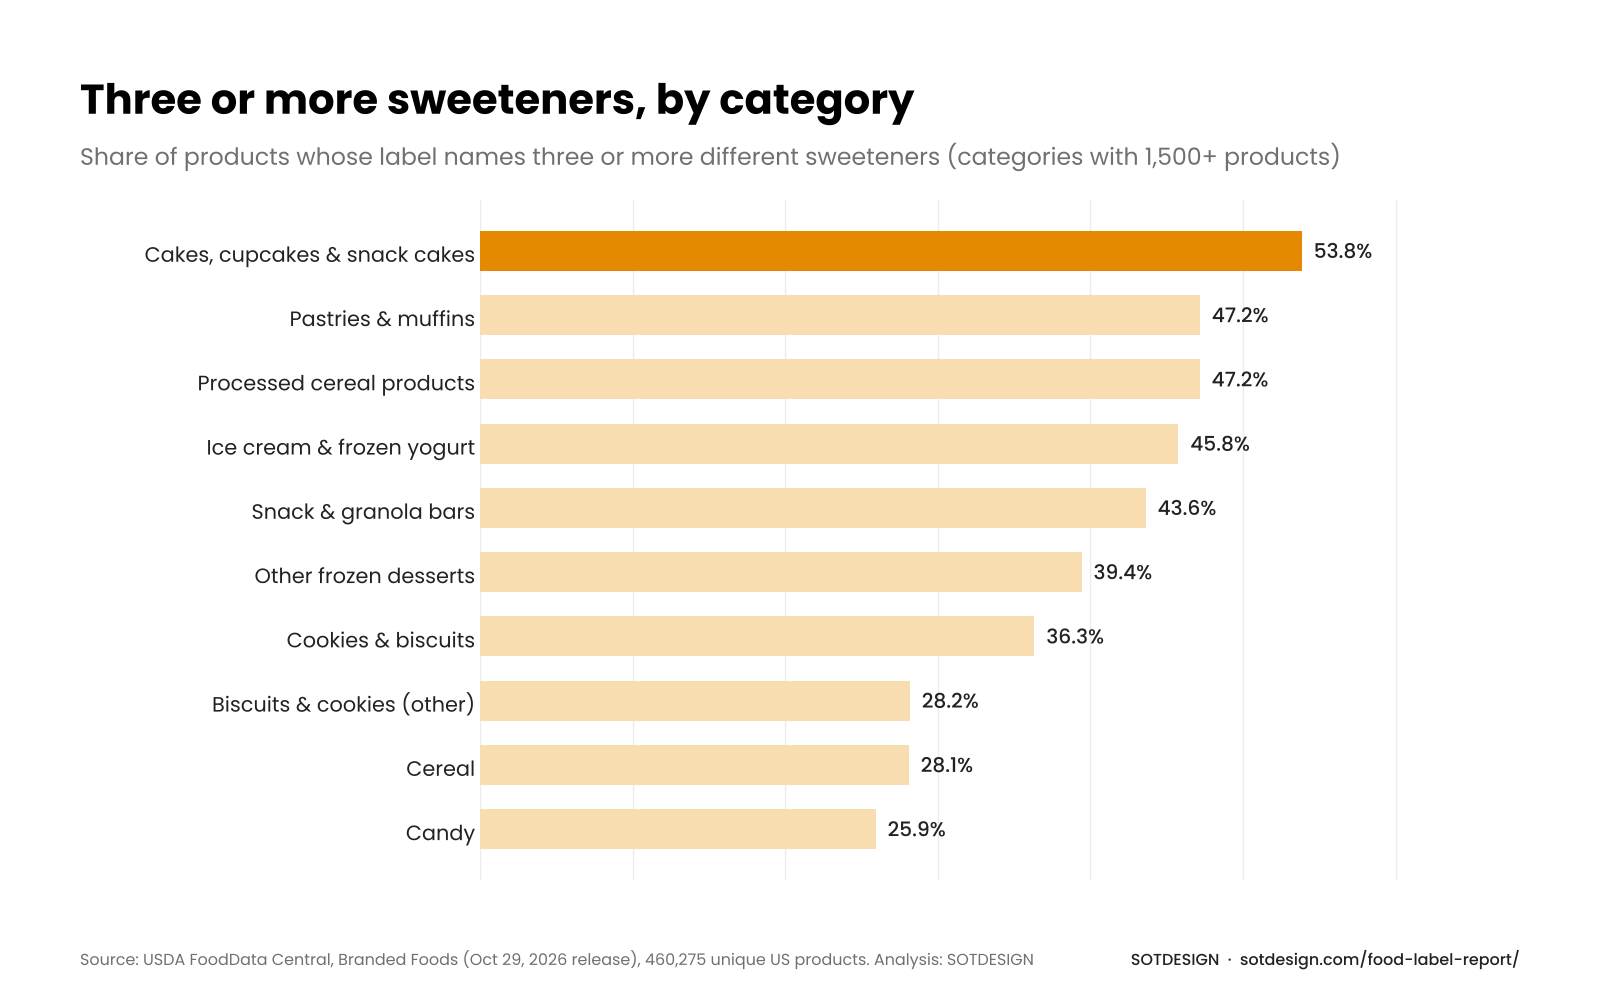
Baked goods and frozen desserts lead on several sweeteners per label. The share of products with three or more names is 53.8% in cakes and snack cakes, 47.2% in both pastries and processed cereal products, 45.8% in ice cream and frozen yogurt, and 43.6% in snack, energy, and granola bars. Candy is at 25.9%.
Different sweeteners do different jobs in a recipe: one adds sweetness, another keeps a texture soft or helps a bake brown. On the label, each one is listed under its own name in the ingredient list, while the Nutrition Facts panel counts their sugars together, in grams, in one Added Sugars line.
The claims brands put on the front of the pack
USDA data doesn’t record front-of-pack claims, so for this part we used Open Food Facts, an open database where users and brands record products, photos, and labels. Of its US products, 156,394 have at least one recorded label or claim. Among them:
| Claim | Share of products with recorded labels |
|---|---|
| Gluten-free | 34.8% |
| Organic | 22.9% |
| Non-GMO | 22.2% |
| Vegetarian | 15.2% |
| Vegan | 14.8% |
| Kosher | 10.5% |
| No artificial flavors | 7.1% |
| No preservatives | 6.8% |
| No added sugar | 2.7% |
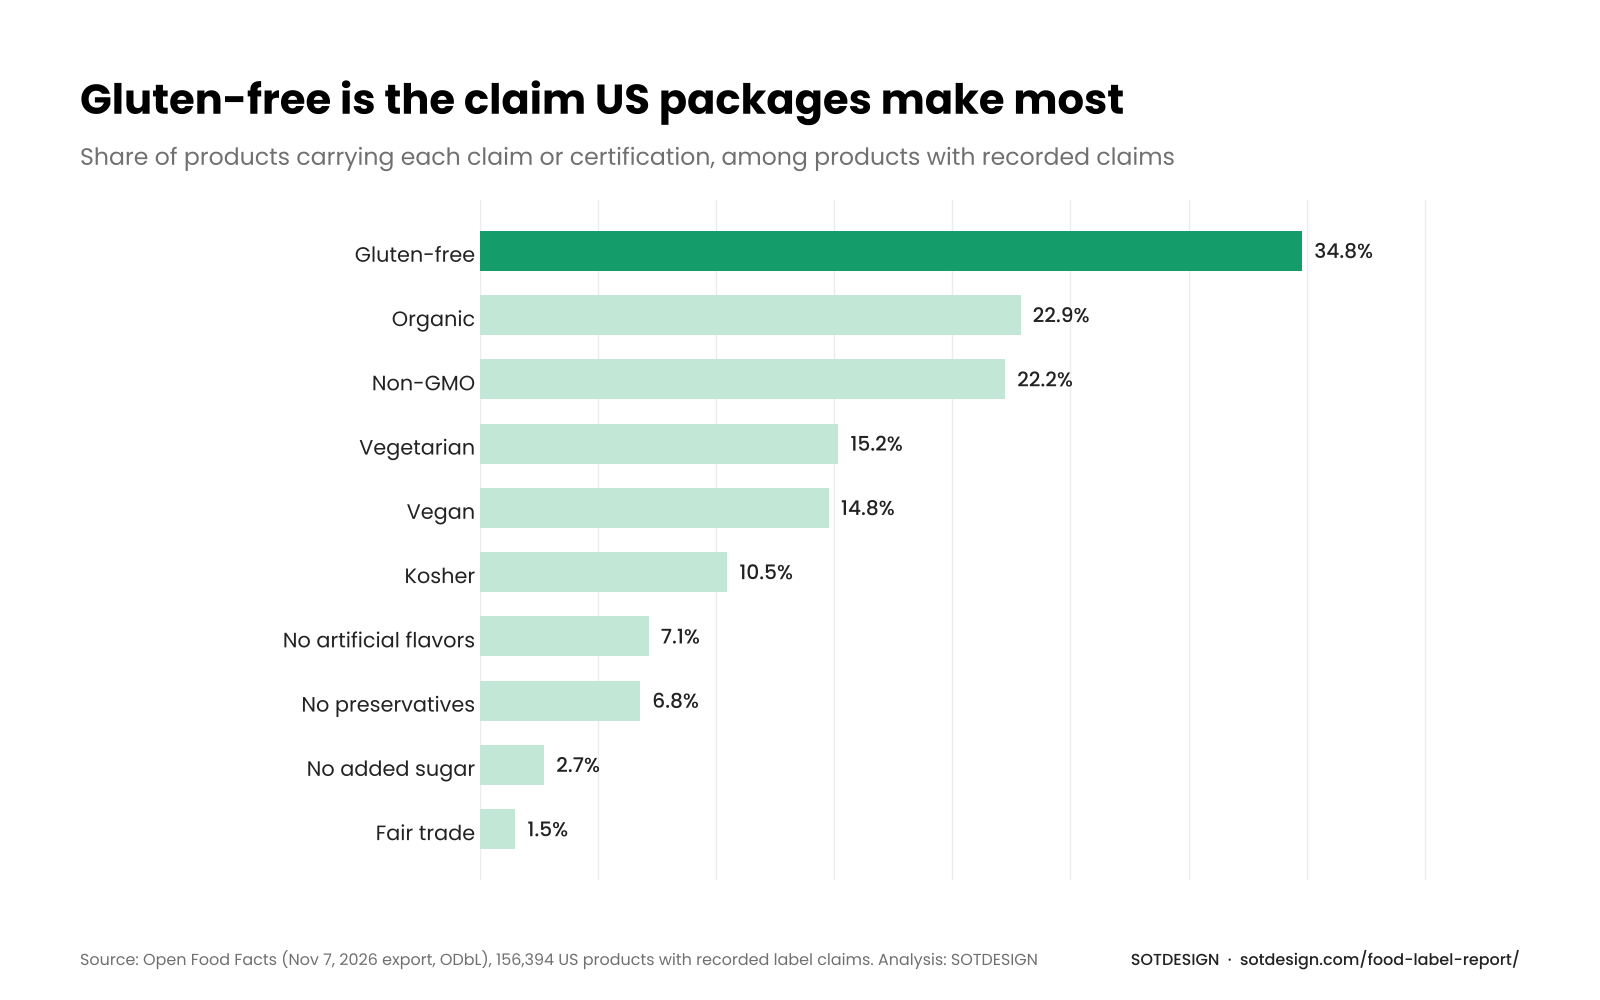
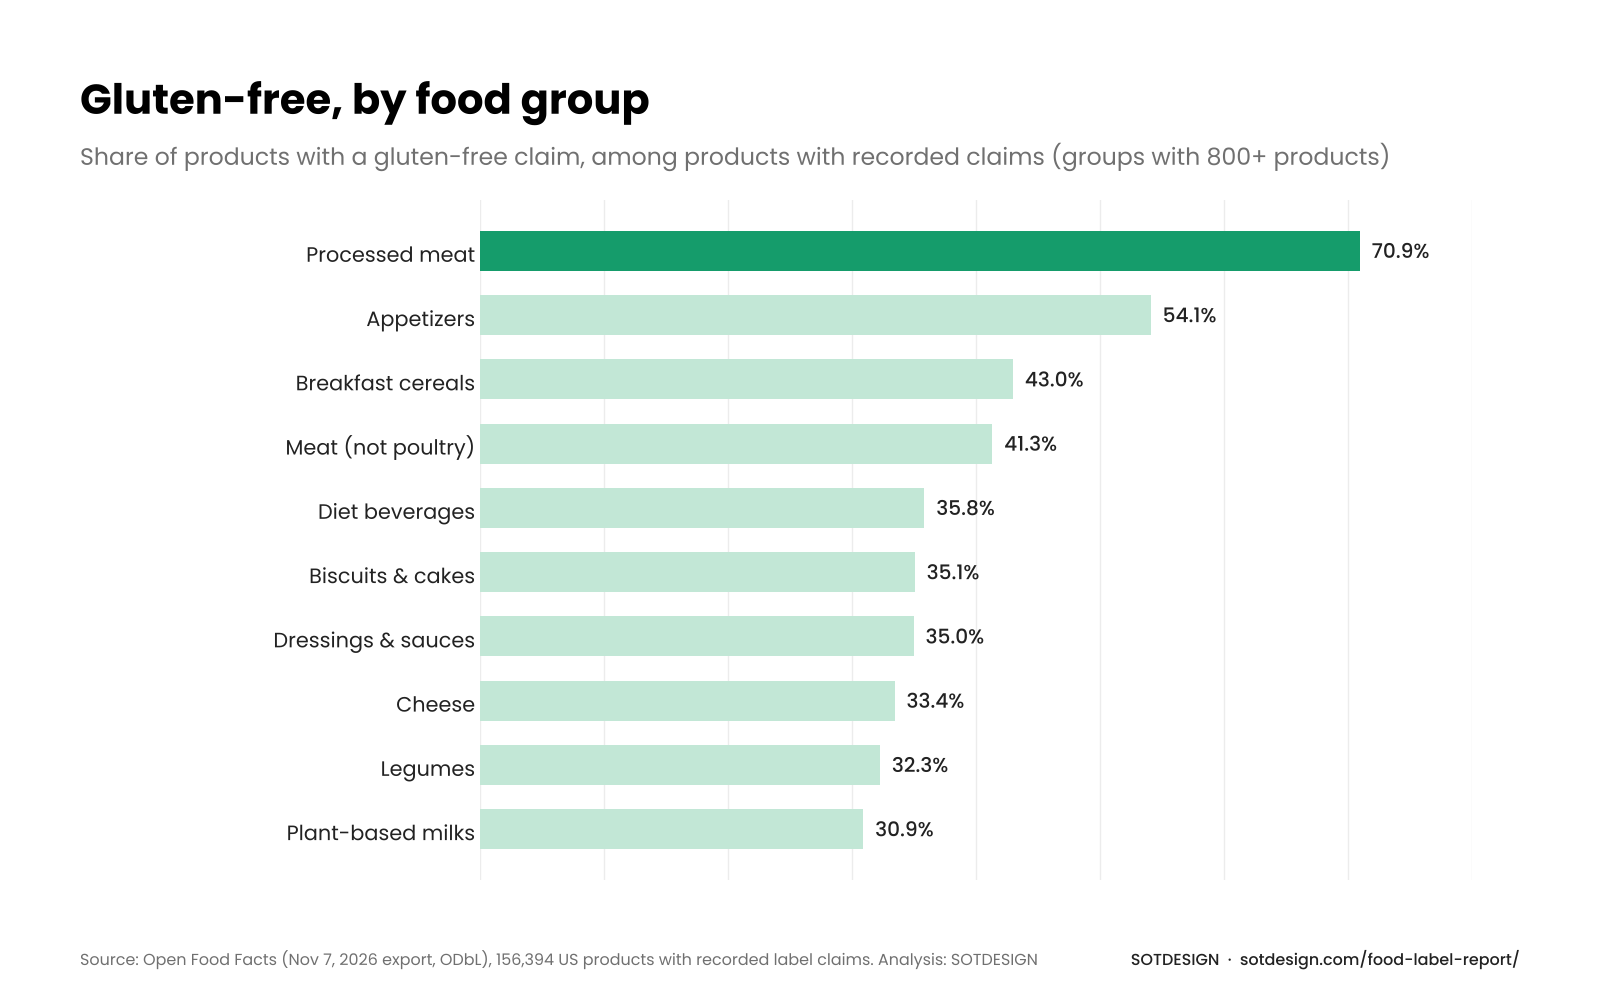
Gluten-free leads by a wide margin, and it shows up in places where shoppers may not expect a gluten question at all. In processed meat, 70.9% of products with recorded labels carry it. Appetizers (54.1%), breakfast cereals (43.0%), and dressings and sauces (35.0%) are high too. The claim is regulated: a food labeled gluten-free has to stay under 20 parts per million of gluten, and the claim may be used on foods that are gluten-free by nature, such as bottled water or fresh produce (21 CFR 101.91). For a brand, it is a low-cost claim when it is true, and many brands make it.
Where “natural” appears in product names
In the USDA data, 5,804 products have “natural” in the name itself. Among categories with at least 1,500 products, the one where it is most frequent by share is water: 12.2% of water products use it, mostly in standard names such as “natural spring water”, “sparkling natural mineral water”, and “with natural CO2”. Cheese comes second at 6.1%, mostly as “natural cheese”, the industry term for cheese that is not process cheese.
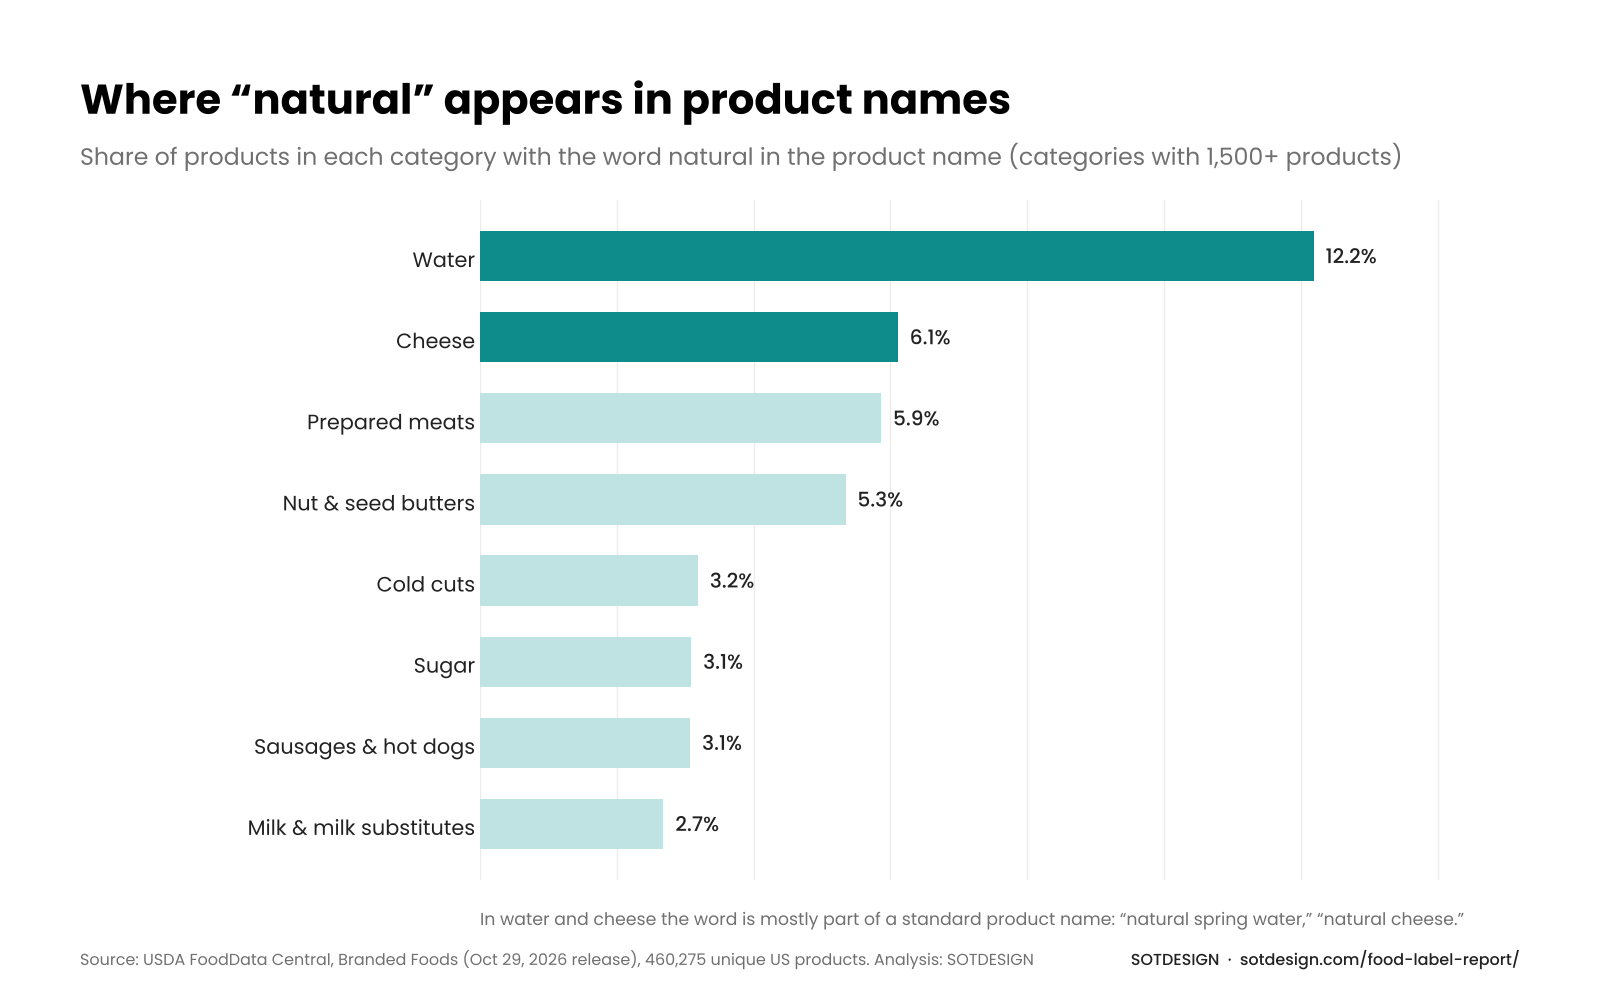
So in most of these cases, “natural” is simply part of a standard product name. FDA has no formal definition of the word for food in general. “Organic”, by comparison, is defined by the USDA National Organic Program, and 23,066 products (5.0%) have it in their name.
Method
USDA data
We used the USDA FoodData Central Branded Foods dataset, October 2026 release (version published October 29, 2026), downloaded on November 9, 2026 (FoodData Central). It holds product records submitted by manufacturers and data partners. We kept records for the US market (1,977,603) and removed repeated versions of the same product by GTIN/UPC barcode, keeping the most recent record for each. That left 460,275 unique products. Categories are the ones assigned in the dataset.
Dyes
We searched ingredient text, ignoring case, for the seven FD&C dyes certified for general use: Red 3, Red 40, Yellow 5, Yellow 6, Blue 1, Blue 2, and Green 3. Each was matched by its short name, its FD&C name, its chemical name, and its E number; lakes count with their dye. Orange B, whose listing FDA revoked in 2026, and Citrus Red No. 2, permitted only on orange skins and proposed for revocation, are not included. We checked samples of matches by hand for false hits.
Ingredient counts
We removed the allergen and facility statements that follow the list, removed sub-ingredients in parentheses and brackets, and counted the remaining items separated by commas or semicolons.
Sweeteners
We counted 18 names: sugar and sugars, high fructose corn syrup, corn syrup, dextrose, fructose, glucose and glucose syrup, honey, molasses, cane juice and cane syrup, invert sugar and invert syrup, maple syrup, agave, rice syrup, tapioca syrup, malt syrup and barley malt, sucrose, maltose, and fruit juice concentrate. Each name counts once per product. We left out maltodextrin, lactose, and allulose, which are used for other reasons or are treated differently on the Nutrition Facts label, and we did not count non-nutritive sweeteners such as sucralose or stevia.
Label claims
Front-of-pack claims come from the Open Food Facts US products export of November 7, 2026, released under the Open Database License (Open Food Facts). Shares are calculated among the 156,394 US products with at least one recorded label.
Cross-check
313,243 products appear in both databases under the same barcode. For them, our “lists a synthetic dye” result agrees in 99.1% of cases, and our Red 3 result in 99.8%. Across all US products in Open Food Facts with a usable ingredient list (415,759), 10.6% list a synthetic dye, and in candy 61.7%. A large part of the Open Food Facts US data was imported from USDA, so the cross-check mainly confirms our matching method rather than the data itself.
Limitations
The data describes what was submitted, not what is on the shelf today: 93% of the records we kept are dated 2021–2023, and some products have been reformulated since. Each product counts once, whatever its sales. Errors in the source text, such as a typo in an ingredient list, carry into the counts. When we say “in the database”, that is what we mean.
How to cite this report
You are welcome to use the numbers and charts from this report with a credit and a link to this page:
SOTDESIGN Food Label Report 2026, based on USDA FoodData Central Branded Foods (October 2026) and Open Food Facts (November 2026). https://sotdesign.com/food-label-report/
USDA FoodData Central data is in the public domain, and Open Food Facts data is available under the Open Database License. Journalists and researchers who need the category tables behind the charts can write to [email protected].
About SOTDESIGN
SOTDESIGN is a branding and packaging design agency for food and beverage brands. We work on label design and packaging design, including the updates a new formula brings: a new ingredient panel, a product color that has shifted, new photography.
new formula, new label?
label and packaging updates for reformulated products · fixed estimate in 1–2 business days
get quoteFAQ
01 What foods have Red Dye 40?
In the USDA database, Red 40 is most common in gelatin desserts (57.6% of products), candy (57.4%), liquid water enhancers (40.9%), baking decorations (40.6%), chewing gum and mints (31.6%), and snack cakes (27.3%). It is also on about one in five sodas, pastries, and sport drinks. Overall, 8.4% of US packaged foods in the data list it.
02 Is Red Dye 40 still allowed in the US?
Yes. Red 40 is still approved for use in food in the US. In 2025 HHS and FDA asked food companies to phase out petroleum-based dyes, including Red 40, on a voluntary basis, and some states have passed their own dye laws. Red No. 3 is the dye with a federal ban.
03 When does the Red 3 ban take effect?
Food manufacturers must stop using FD&C Red No. 3 by January 15, 2027, and makers of ingested drugs by January 18, 2028. California’s ban on Red 3 in food starts on January 1, 2027. In the USDA database, 9,406 product records (2.0%) list Red 3.
04 How can I tell if a food contains Red 40?
Read the ingredient list. Certified colors must be named, so look for FD&C Red No. 40, Red 40, Red 40 Lake, or Allura Red AC. On imported products you may see E129. A phrase such as “color added” or a named source like beet juice means a color exempt from certification was used.
05 Do ketchup, pickles, and maraschino cherries contain dyes?
It depends on the product. Of 906 products with “ketchup” in the name, 14 list Red 40, mostly flavored snacks. Of 2,305 products with “pickle” in the name, 546 (24%) list Yellow 5. Of 246 products with “maraschino” in the name, 204 (83%) list Red 40.
06 What is the difference between Red 3 and Red 40?
They are different synthetic dyes. Red 3 (erythrosine) gives a bright cherry red and is banned in US food from January 15, 2027. Red 40 (Allura Red AC) gives an orange-red, is approved, and is much more common: 38,875 products in our data list Red 40 against 9,406 for Red 3.
07 Can I use these numbers and charts?
Yes. Credit “SOTDESIGN Food Label Report 2026” and link to this page. The underlying data is public: USDA FoodData Central and Open Food Facts.